2021年
2021/1/12
鏡開きも過ぎて、すっかり年が開けてしまいましたが、
本年もどうぞよろしくお願いいたします。
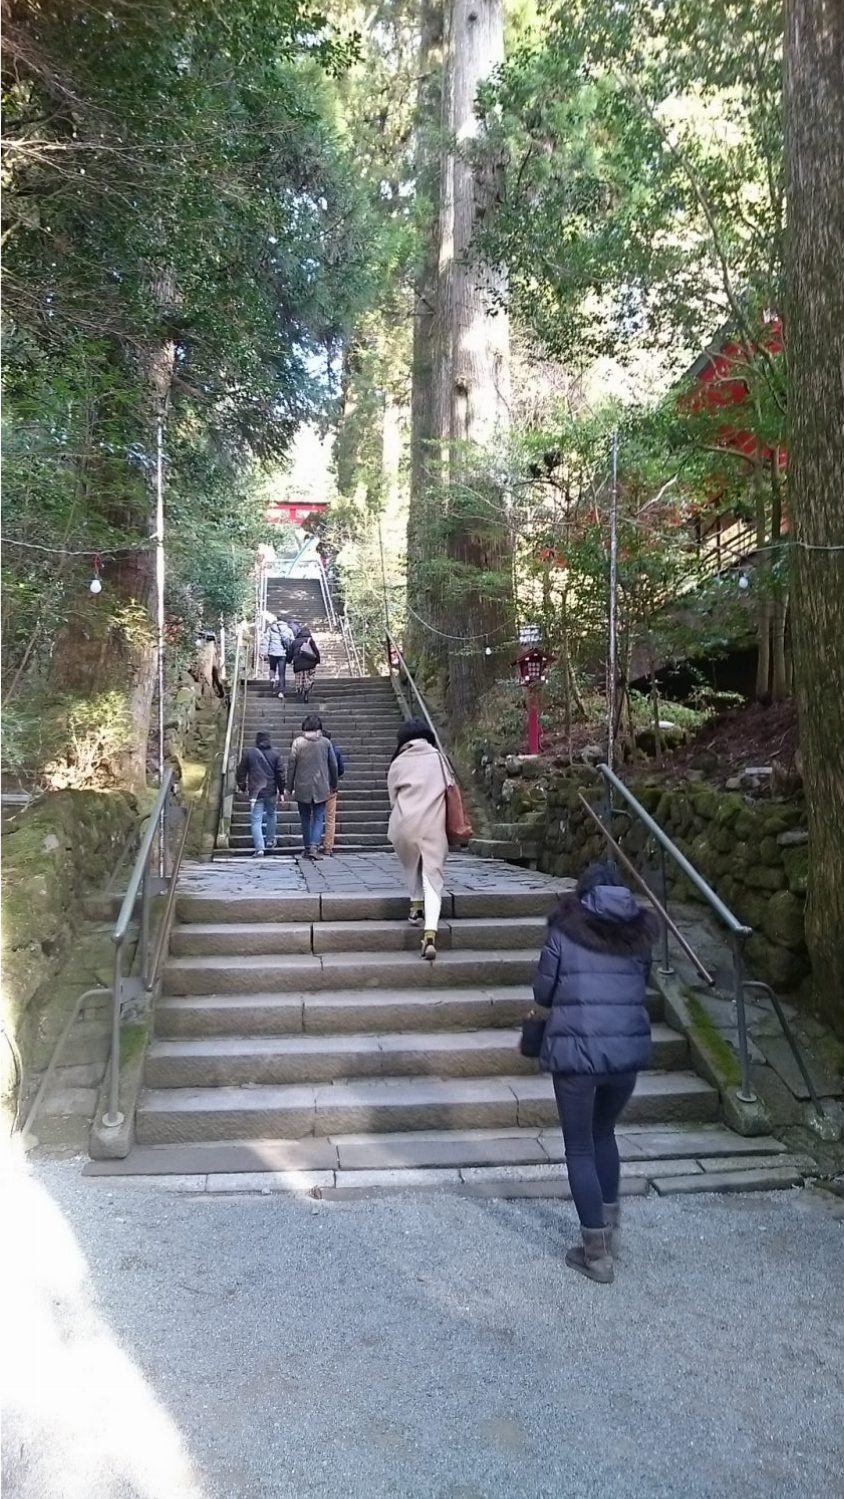
年明けは、恒例の箱根神社のお参りから。
例年に比べ、参拝者は少なく、静かなスタートとなりました。
とにかく健康に、安全にこの一年を過ごせますように。
続 三浦の家(植栽編)
2020/12/28
建物完成時はこんなだったお庭。
桜やサルスベリなど、花を楽しめる木を植えたいというご希望をいただき、
楽居で樹種を選定、植え込みまで行いました。
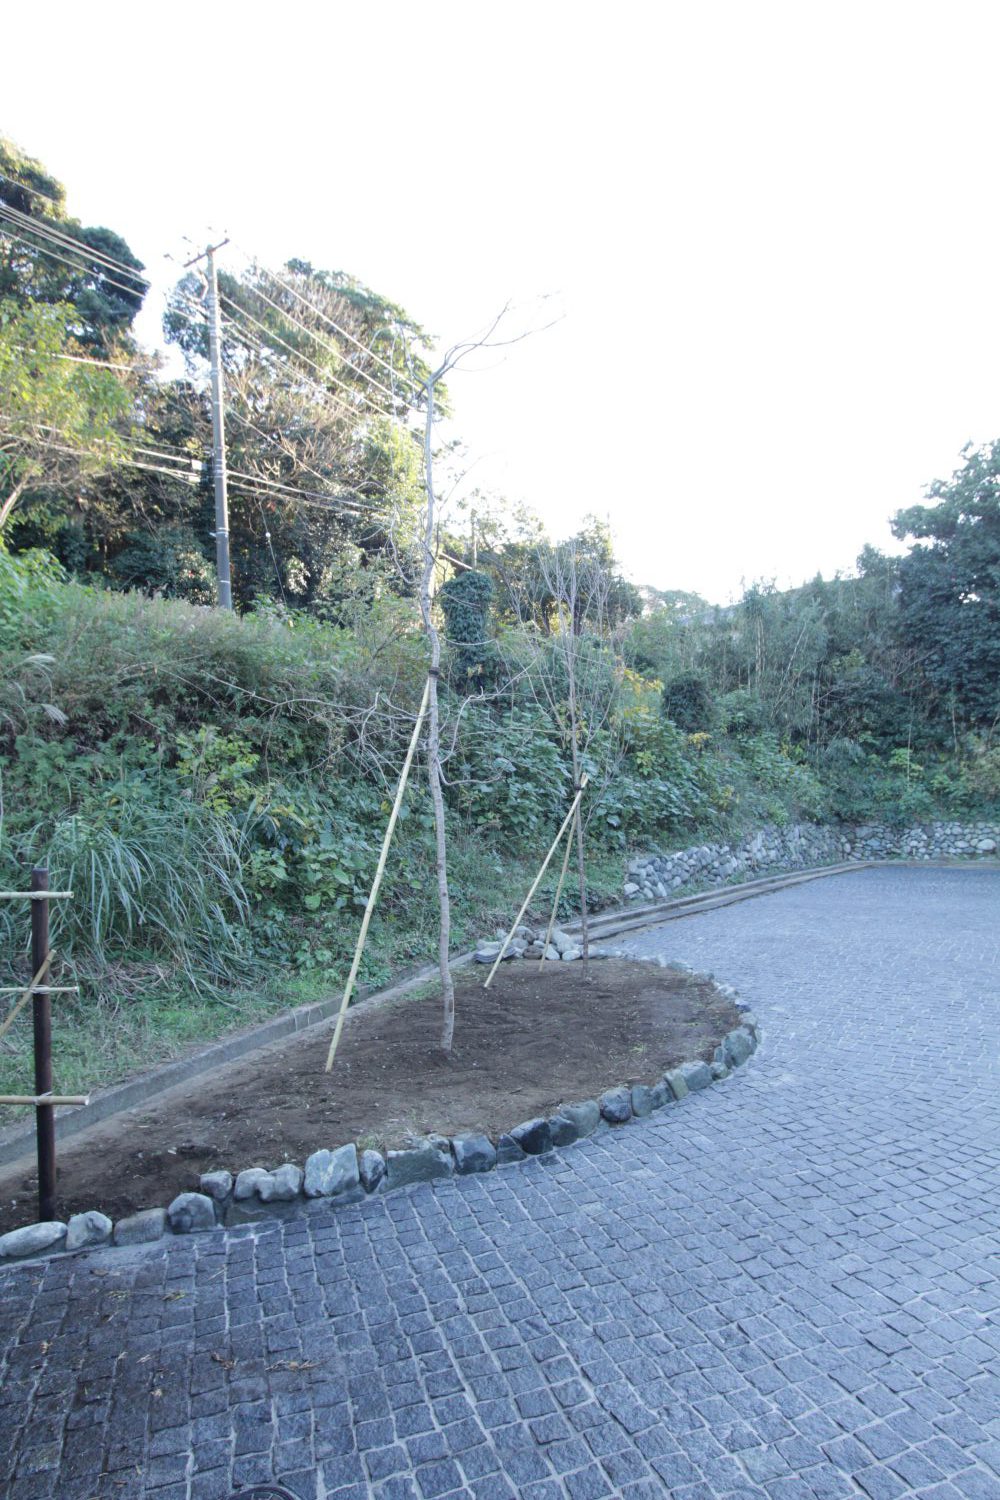
アプローチには紫陽花(エンドレスサマー)
まだまだ小さな株ですが、成長がが早いため、1、2年後の梅雨時には、
青(土壌によってはピンク)の花がモリモリに咲くことでしょう
照明は、シンプルな黒のアッパーライトを採用しました。
ゲート内は、桜を数種類。
手前は枝垂桜(一重)、奥はコヒガンザクラ、
他にも、葉が桜餅の葉に使われるオオシマザクラも植えています。
こちらは梅。
樹高4m指定で畑に頼んだところ、こんな立派な梅が入ってきました!
年明けから咲き始めるのか、、楽しみですね
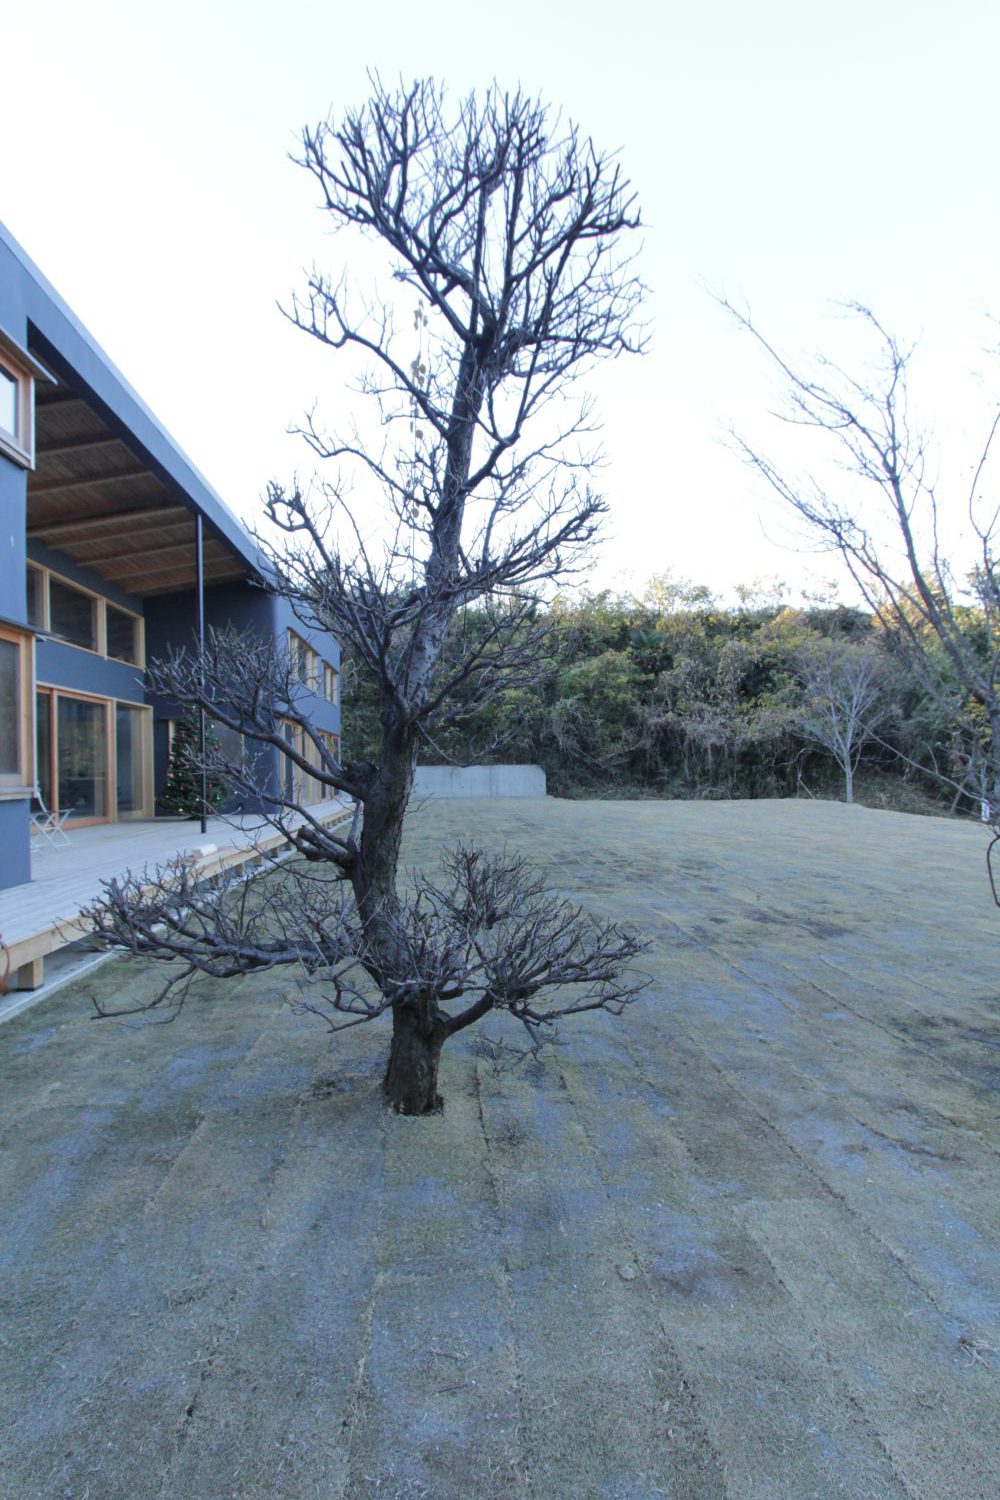
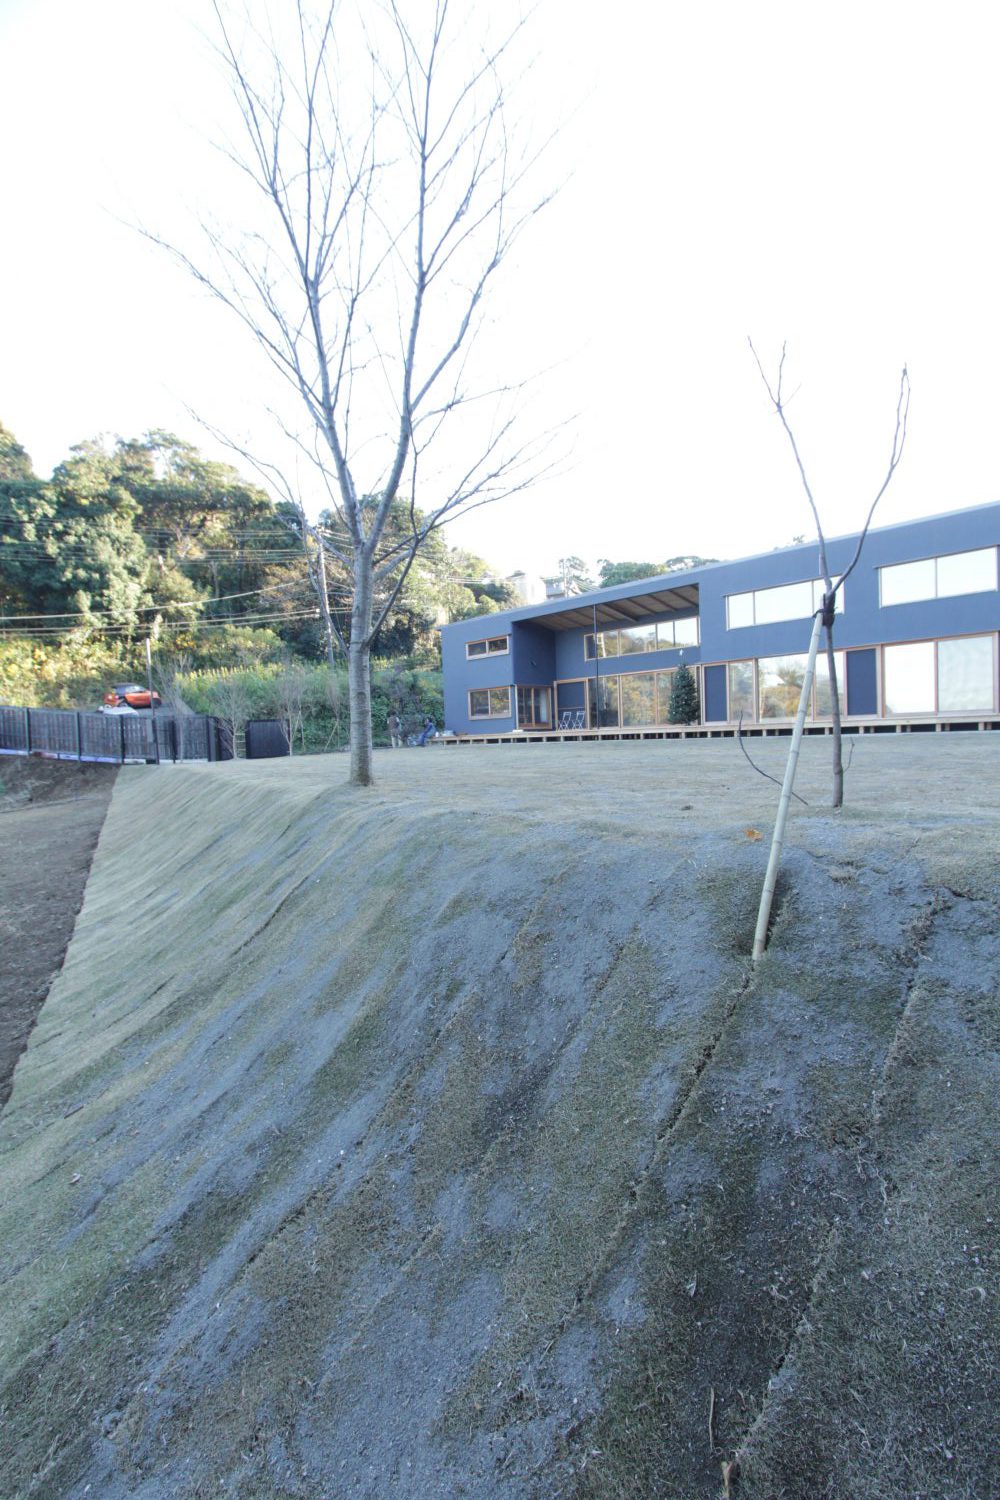
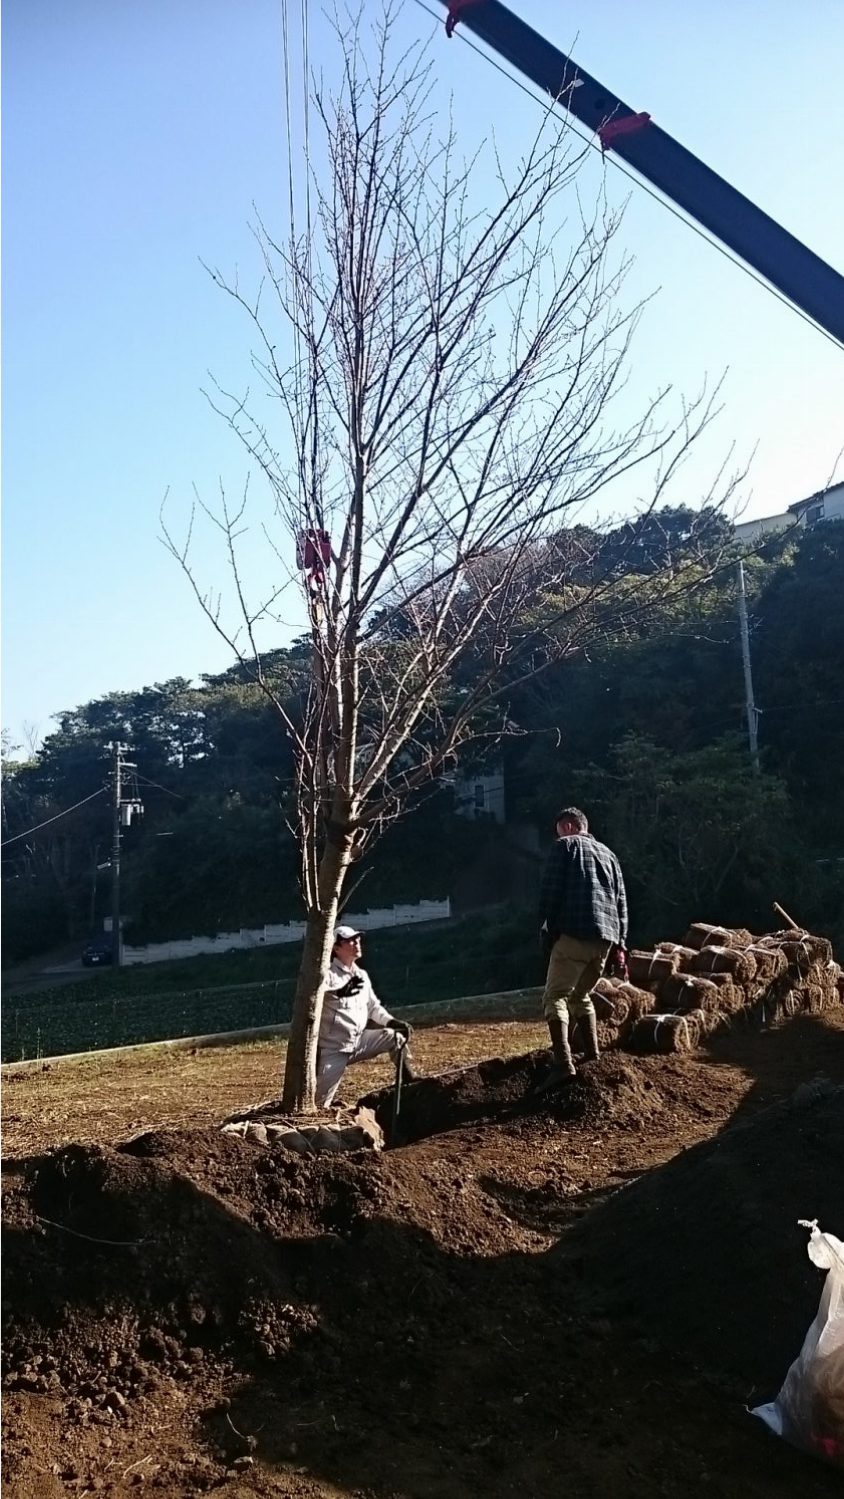
こちらはシンボルツリーとして入れた、樹高6m超えのソメイヨシノ
お庭が広いため、その大きさが分かりづらいですが、隣のイチジクは2mもの。
サイズ感の違い、わかるでしょうか。
もちろん人力で運べるわけもなく、クレーンで吊り上げて植え込みしました。
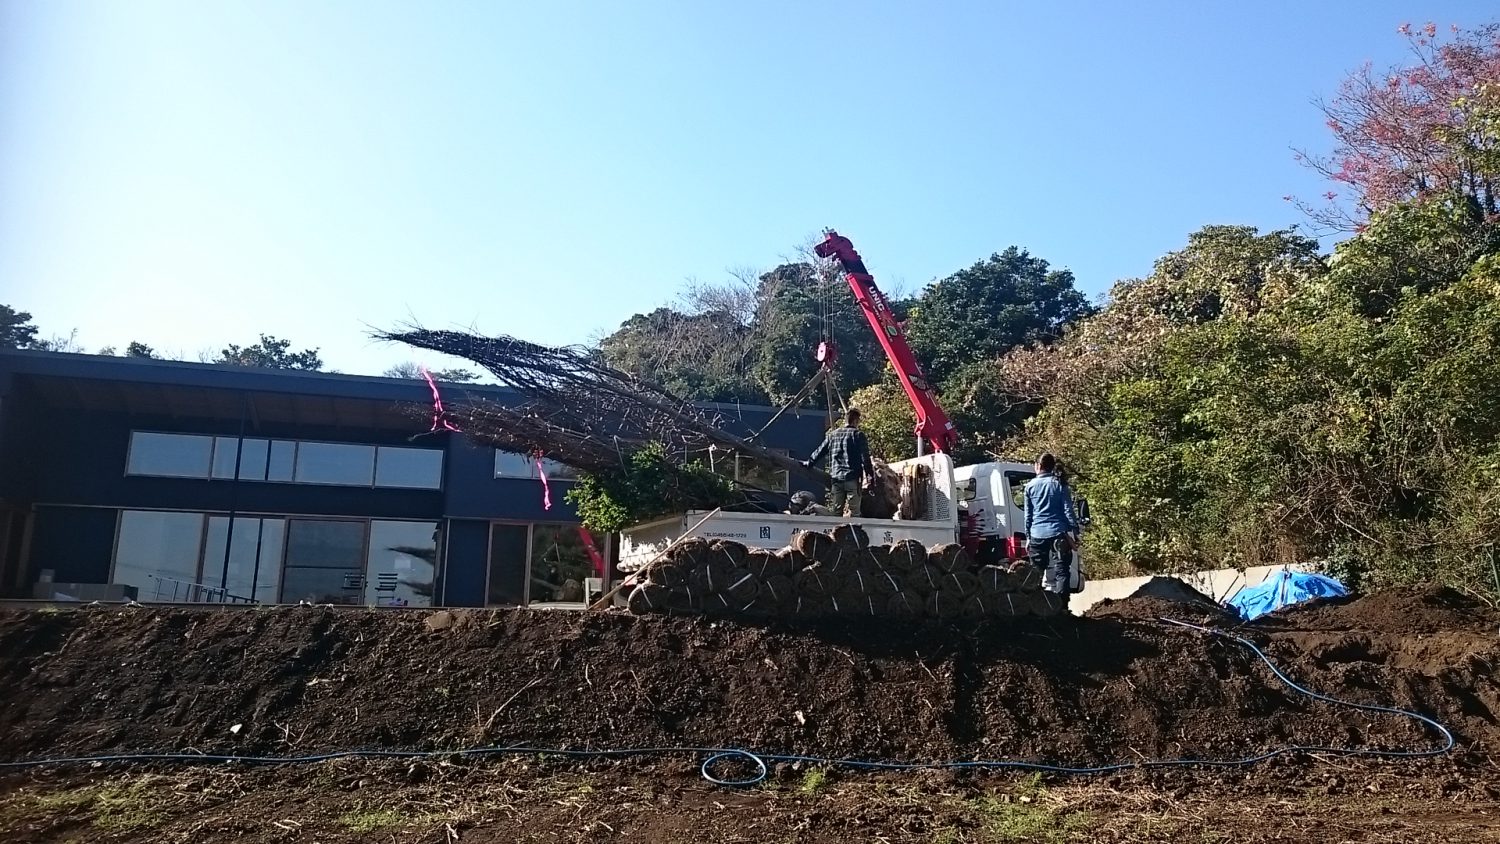
向きを調整するのも一苦労の大きさ
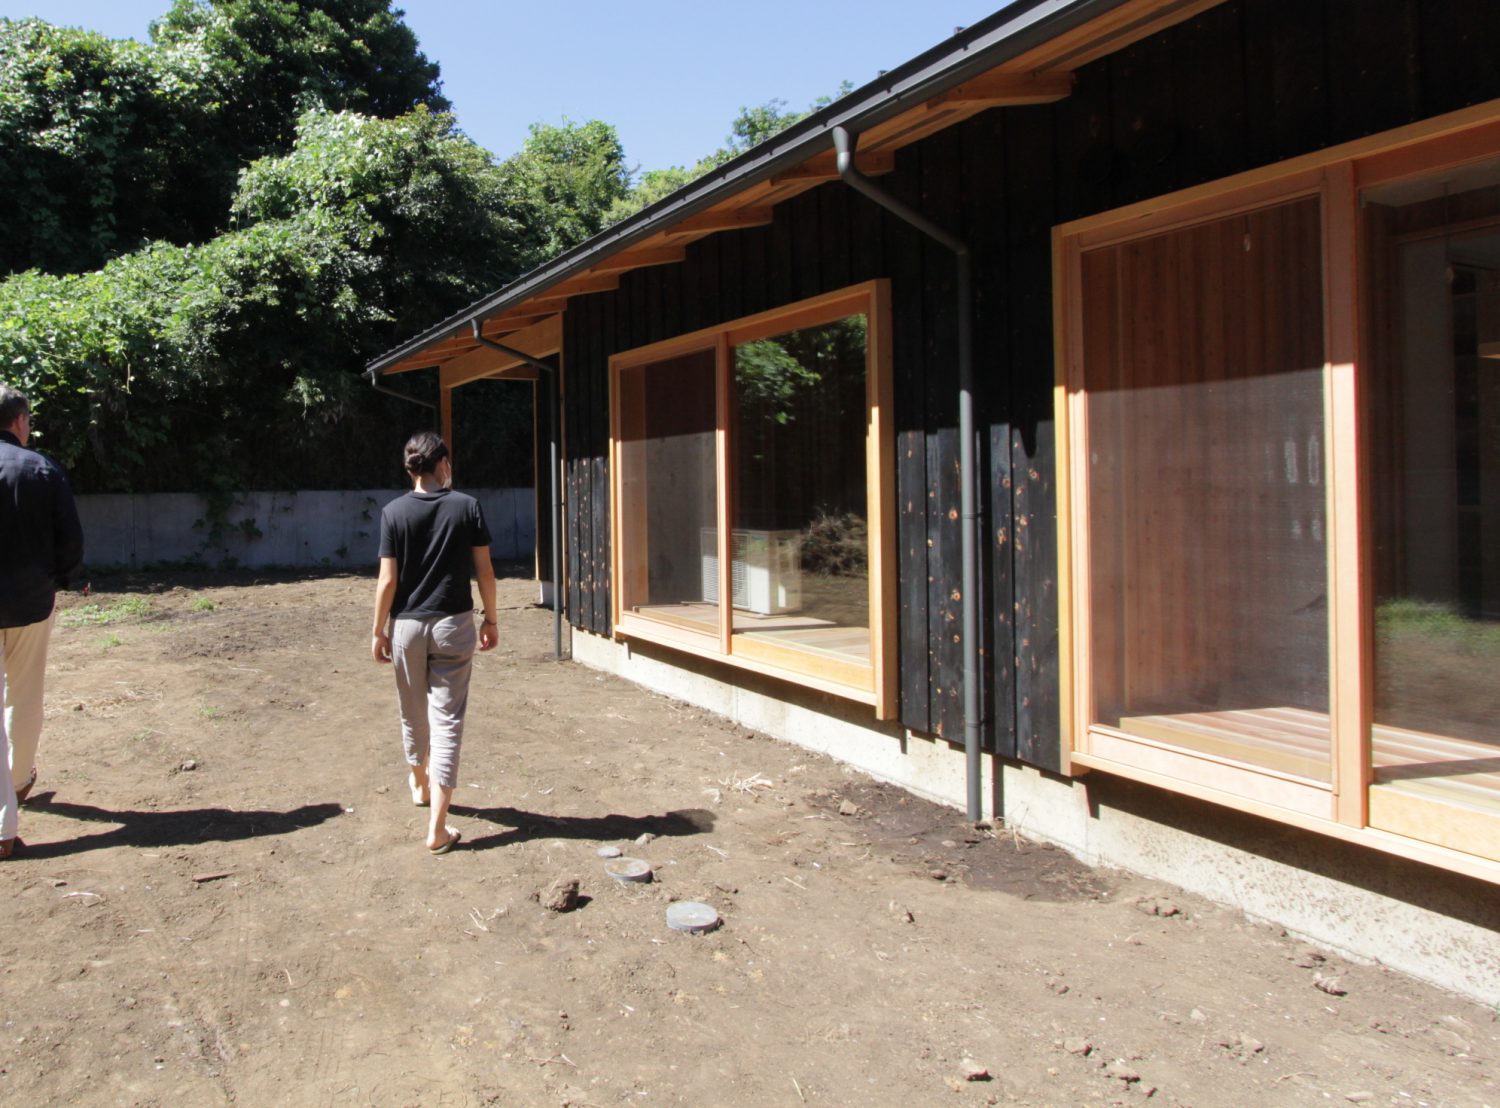
建物反対側のお庭はこちら。芝を敷きこみ、レモンと柚子を植えています。
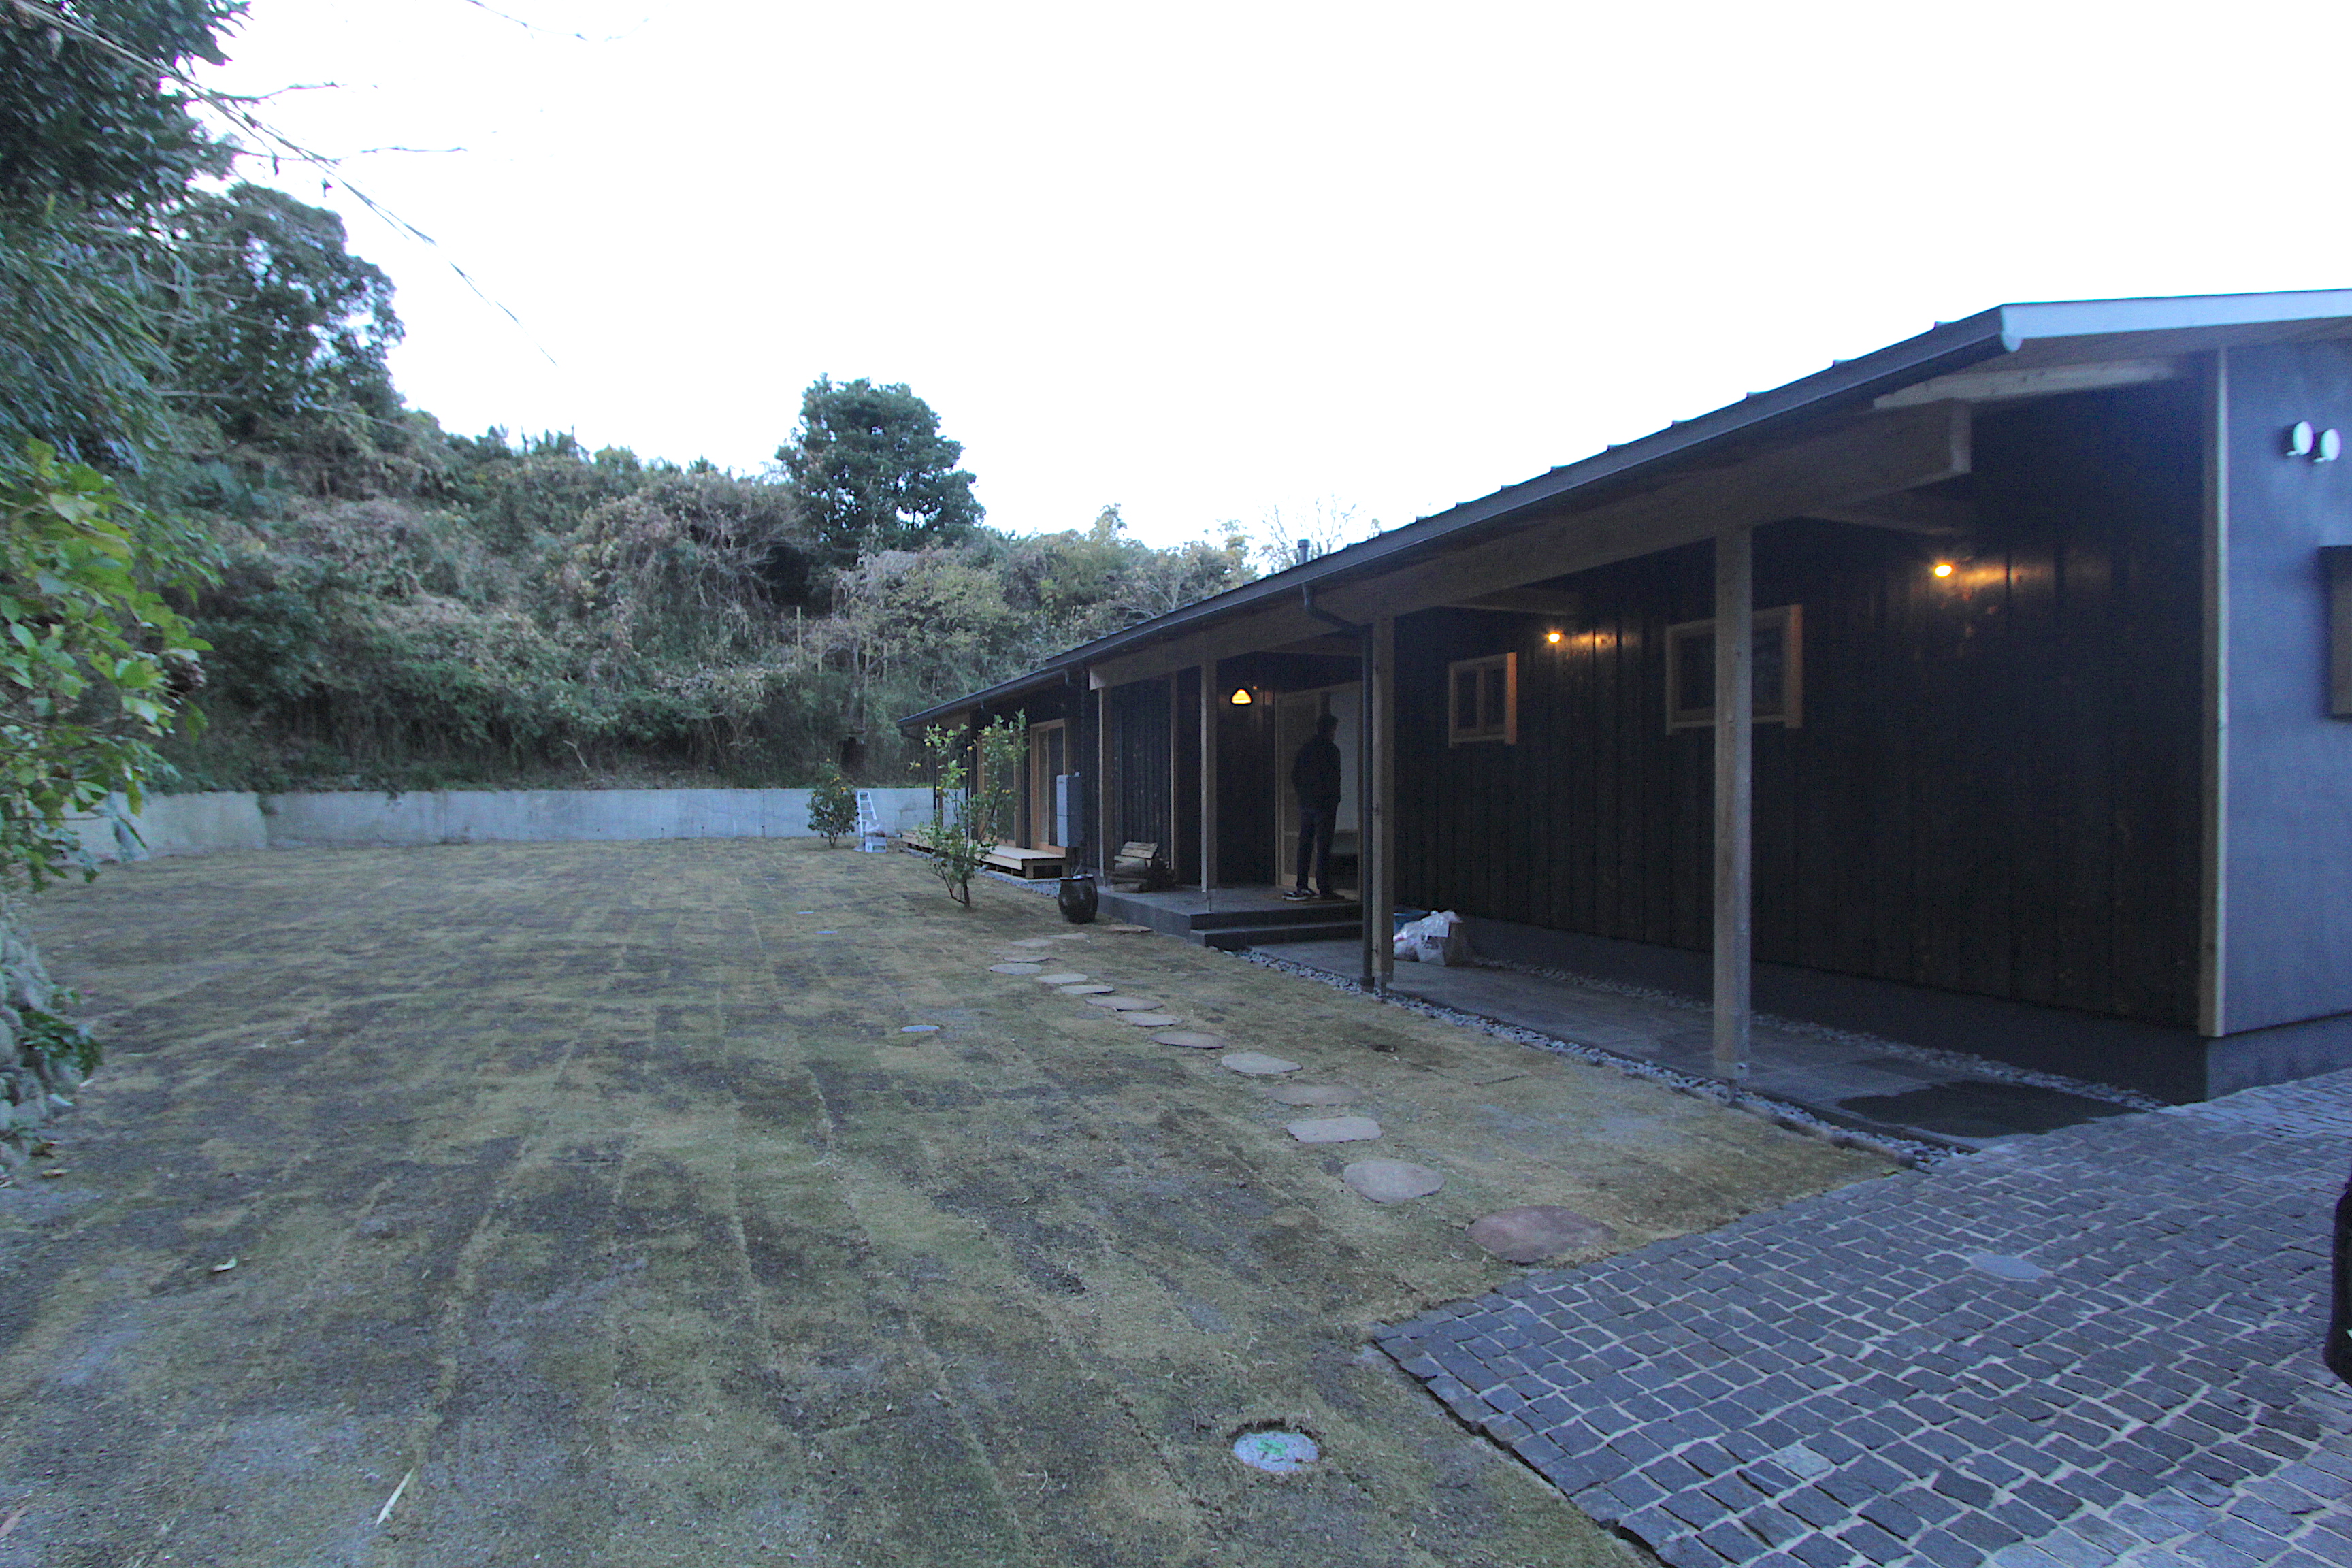
すでに実だくさん
レモンはほぼ毎日お料理に使うそうで、玄関に近い場所に植えています。
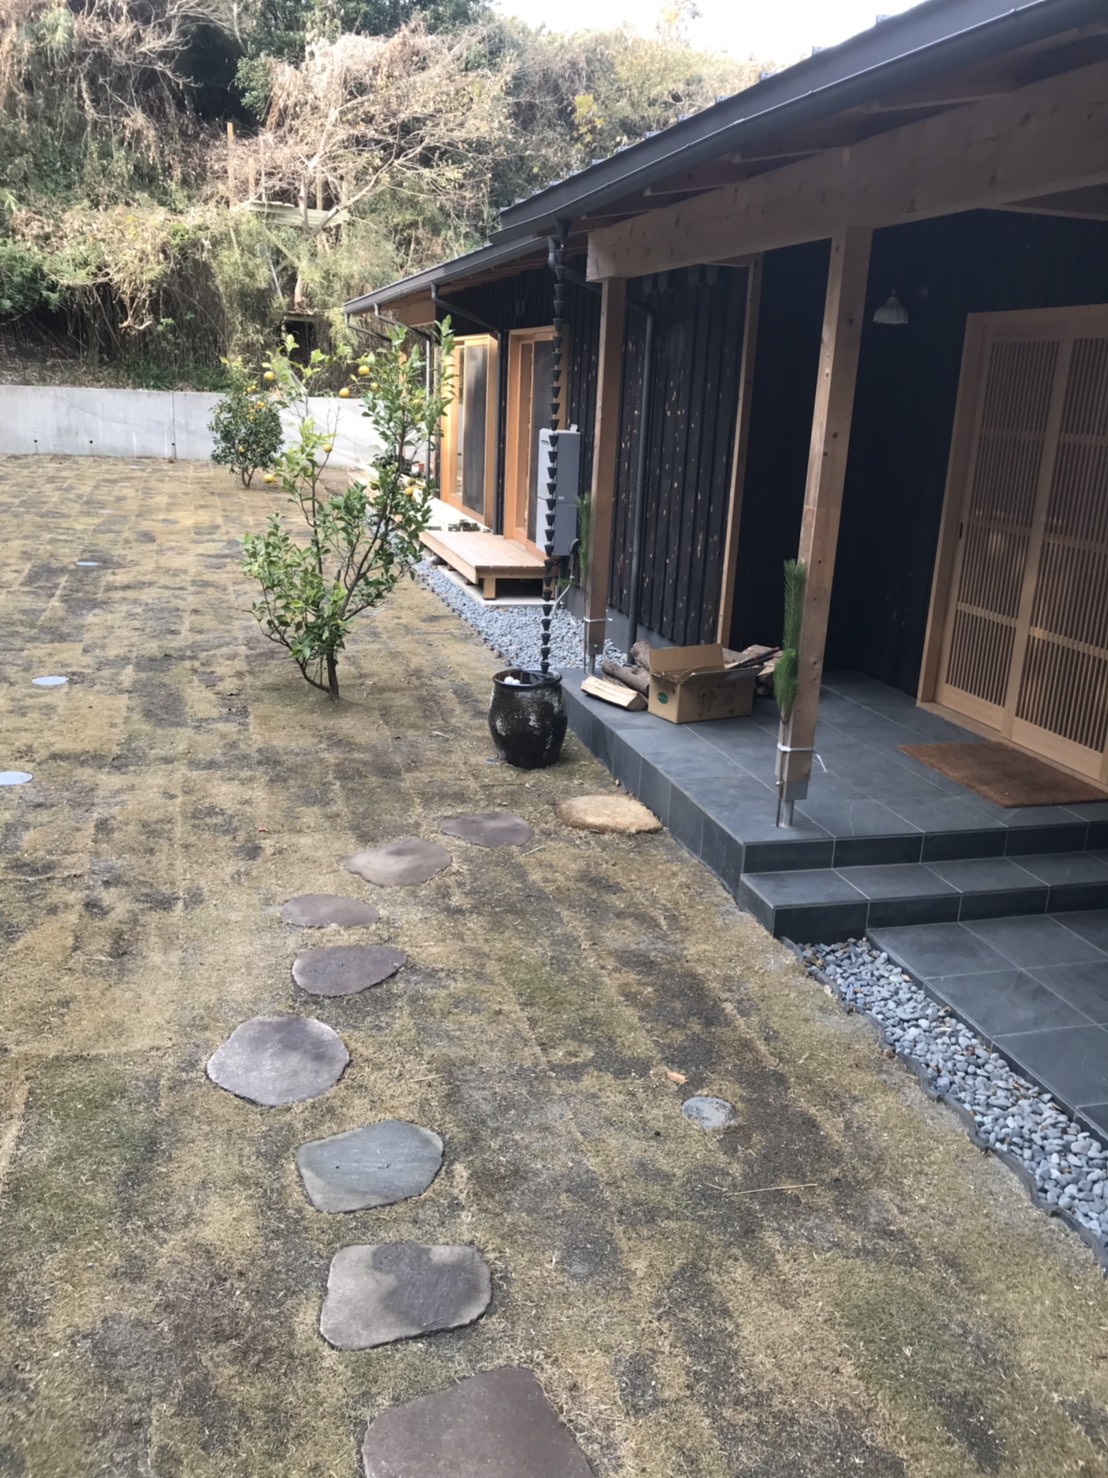
鎖樋の下には、信楽焼きの水瓶を置きました。
(排水も確保しています。)
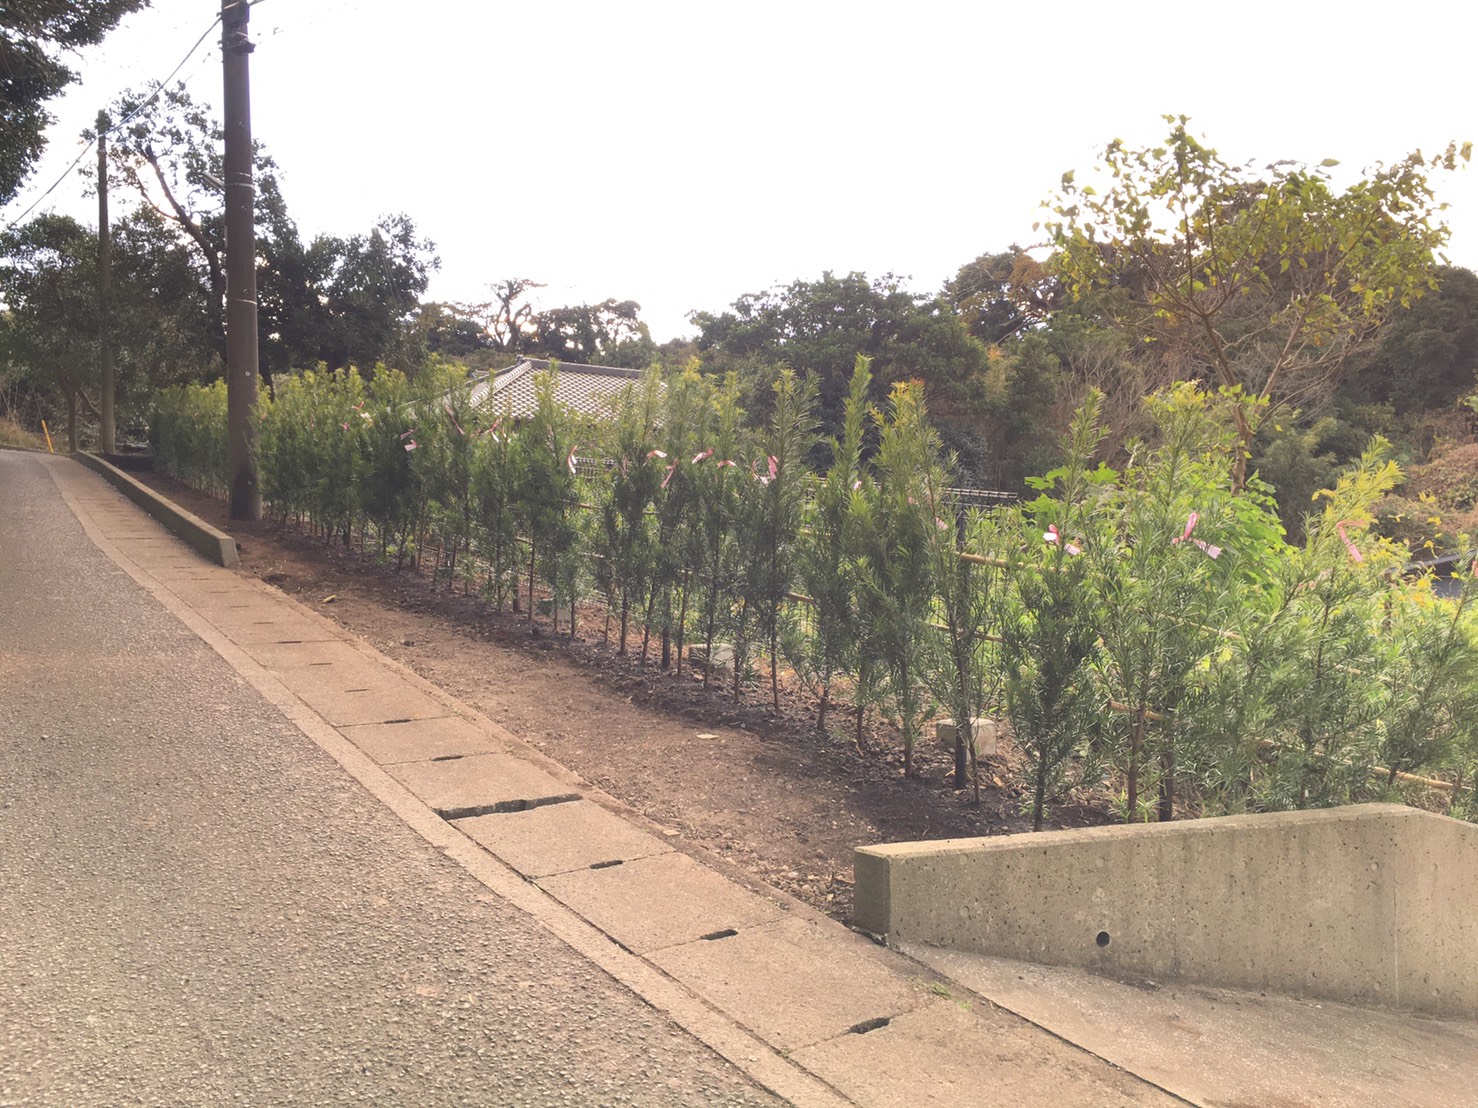
道路沿いには、イヌマキ(ナゴヤマキ)を列植しています。
葉が細かく、サワサワしていて、とても可愛らしい印象です。
生垣に用いられる木のため、しばらくすれば、道路からの目隠しとなります。
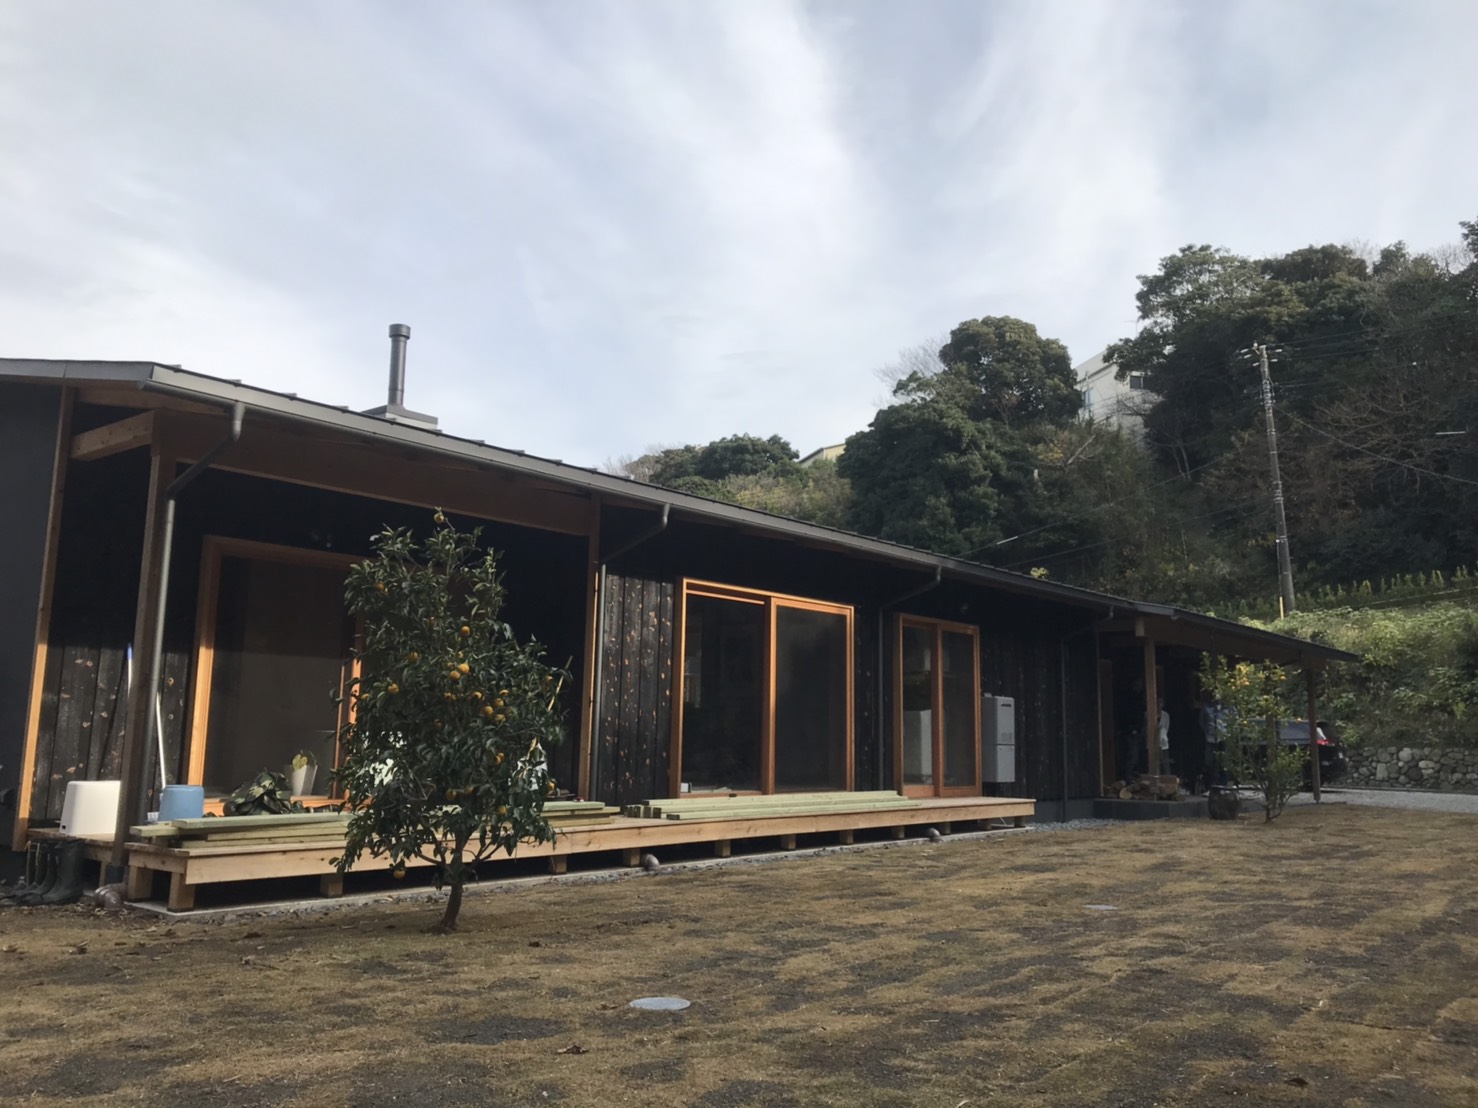
お庭が変われば、建物の見え方、室内からの景色はとても良いものに変わります。
一軒家の良いところのひとつは、お庭があること。
たとえ少ないスペースだったとしても、
家を考えるのと同じように、お庭のことも考えてあげると
暮らしはより豊かになると思います。
春になって、新芽が吹く頃、経過をご紹介できればと思います。
HPにはほんのチョットしか記載していませんが、
楽居では庭づくりのみの相談も承っており、年間数件のお庭をデザインから施工まで行っております。
(みなさんどこから嗅ぎつけてくるのかな、、?)
植栽のお手入れをあまりできない方には、ある程度放ったらかしにできる提案も可能です。
家を建てたけど、庭はまだ手付かずです。という方は、
ぜひ一度ご連絡ください。
続 三浦の家(外構編)
2020/12/25
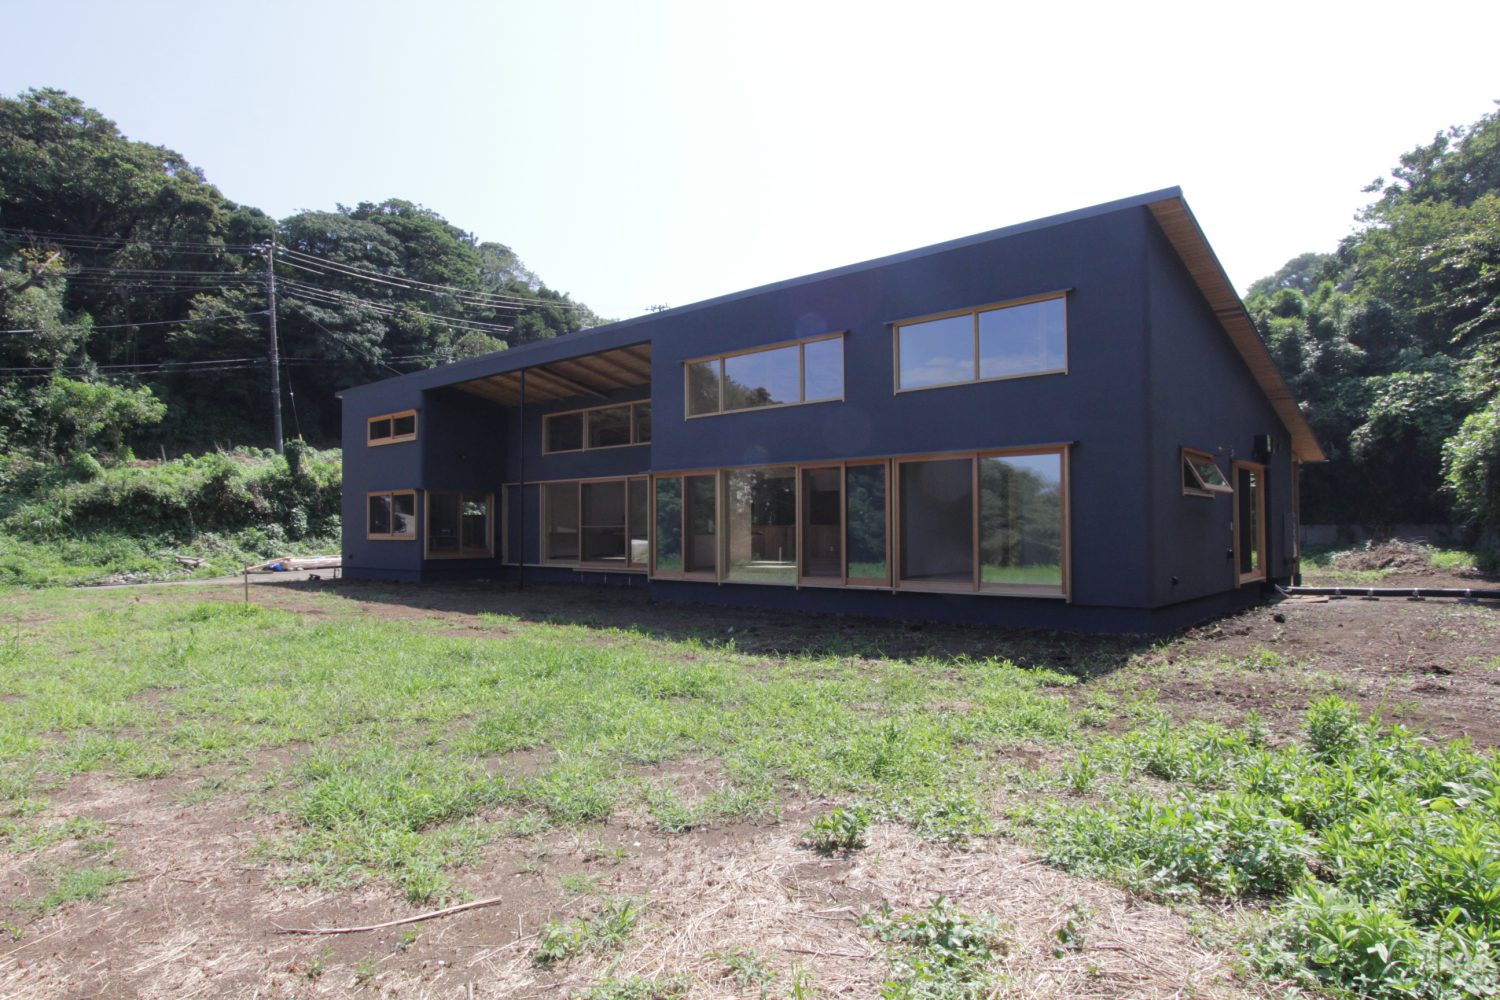
三浦の家の外構工事が先日完成し、ようやく全工程を終えました。
今日はその外構をご紹介します。
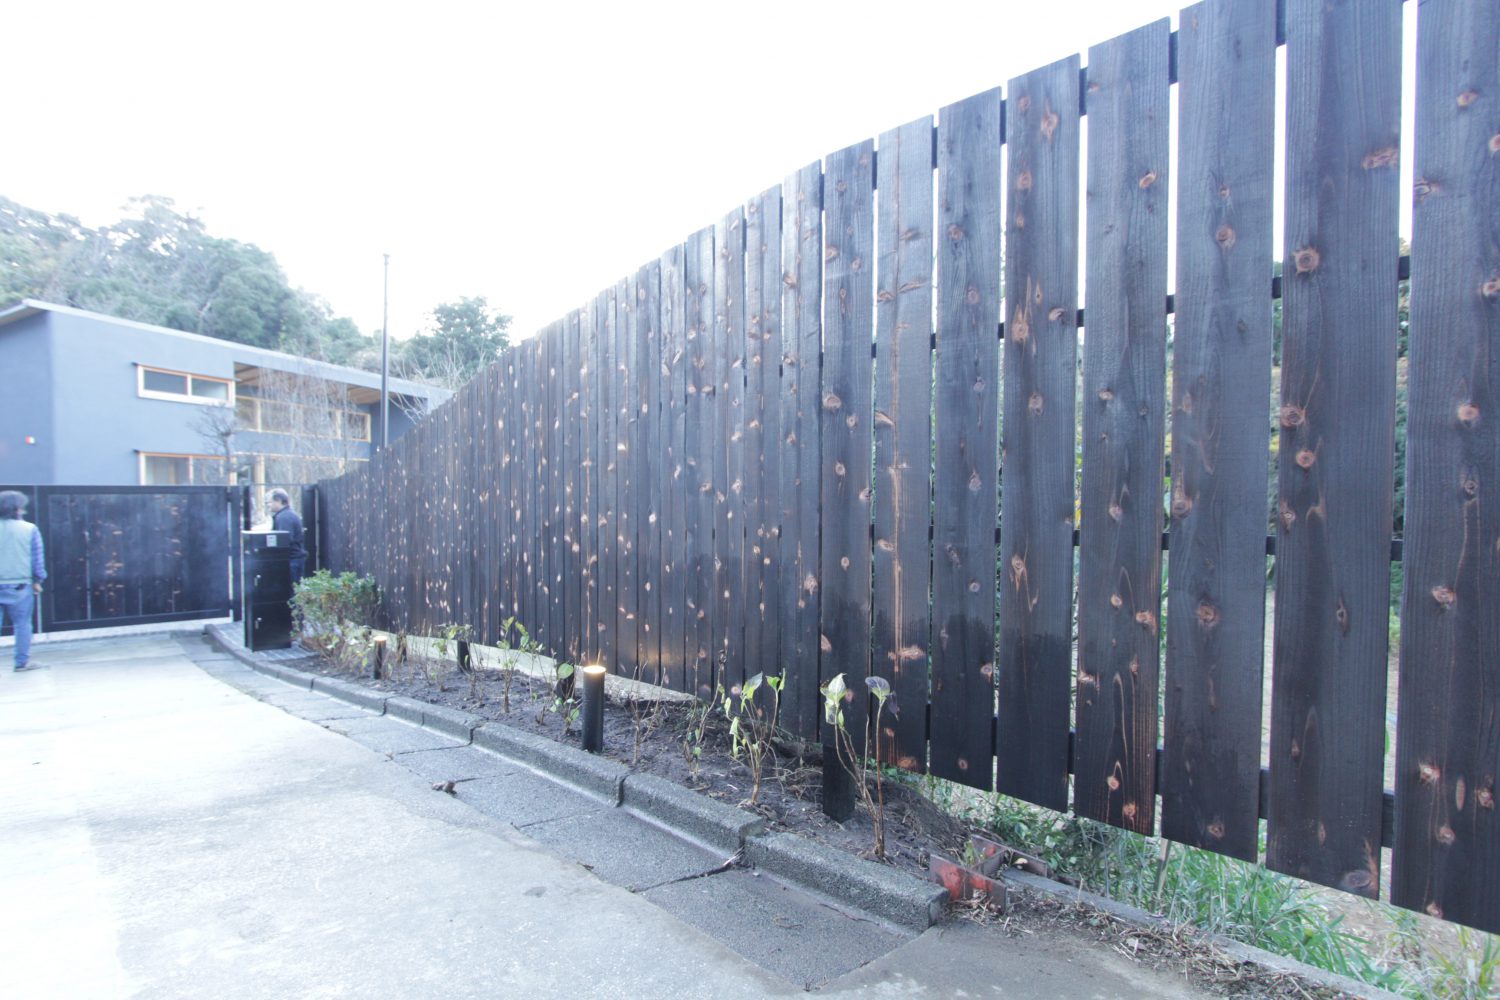
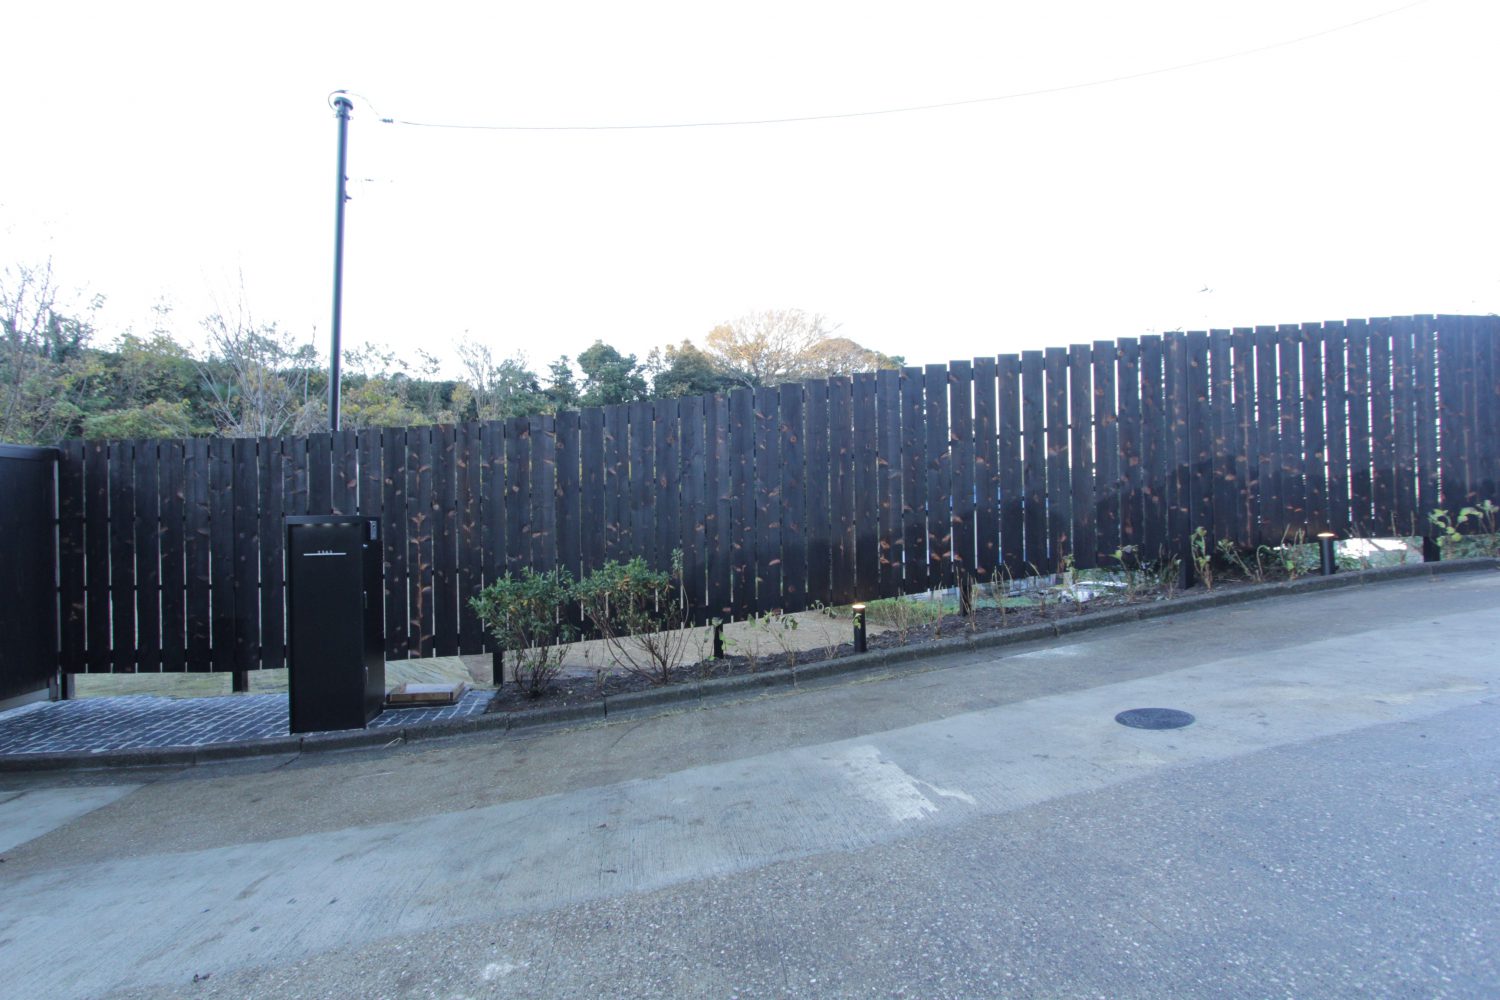
建物外壁にも使った焼杉で、板塀とゲートを作りました。
ポスト&宅配ボックスも黒で統一
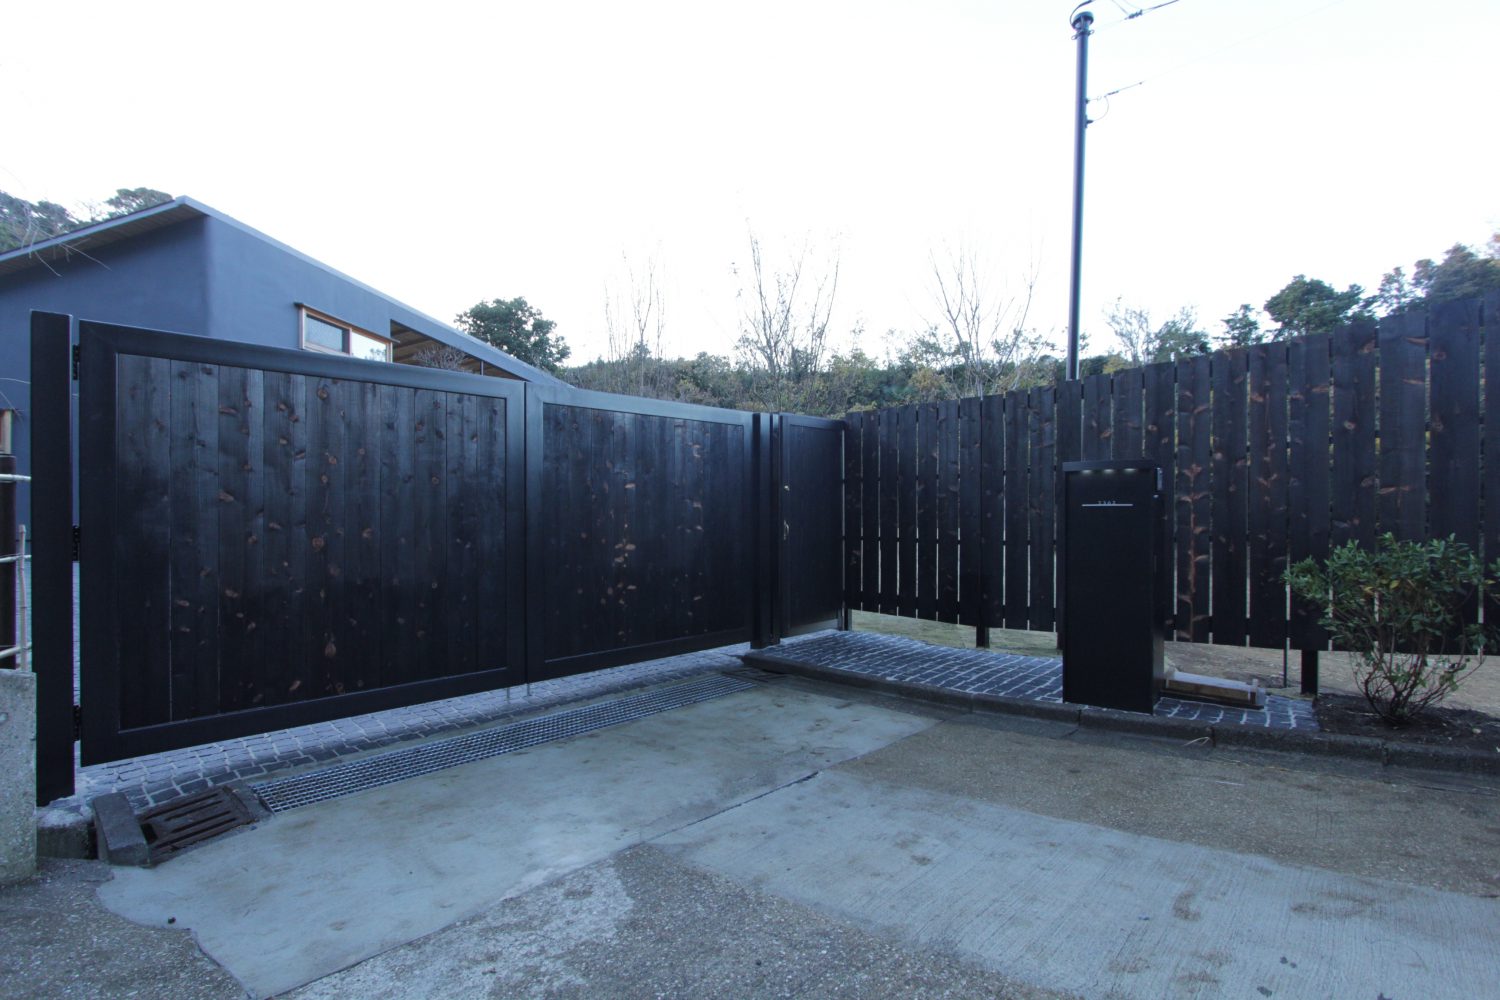
板塀の足元には、紫陽花を植え込みました。
紫陽花と焼杉の黒のコントラストがどのように出るか、楽しみです
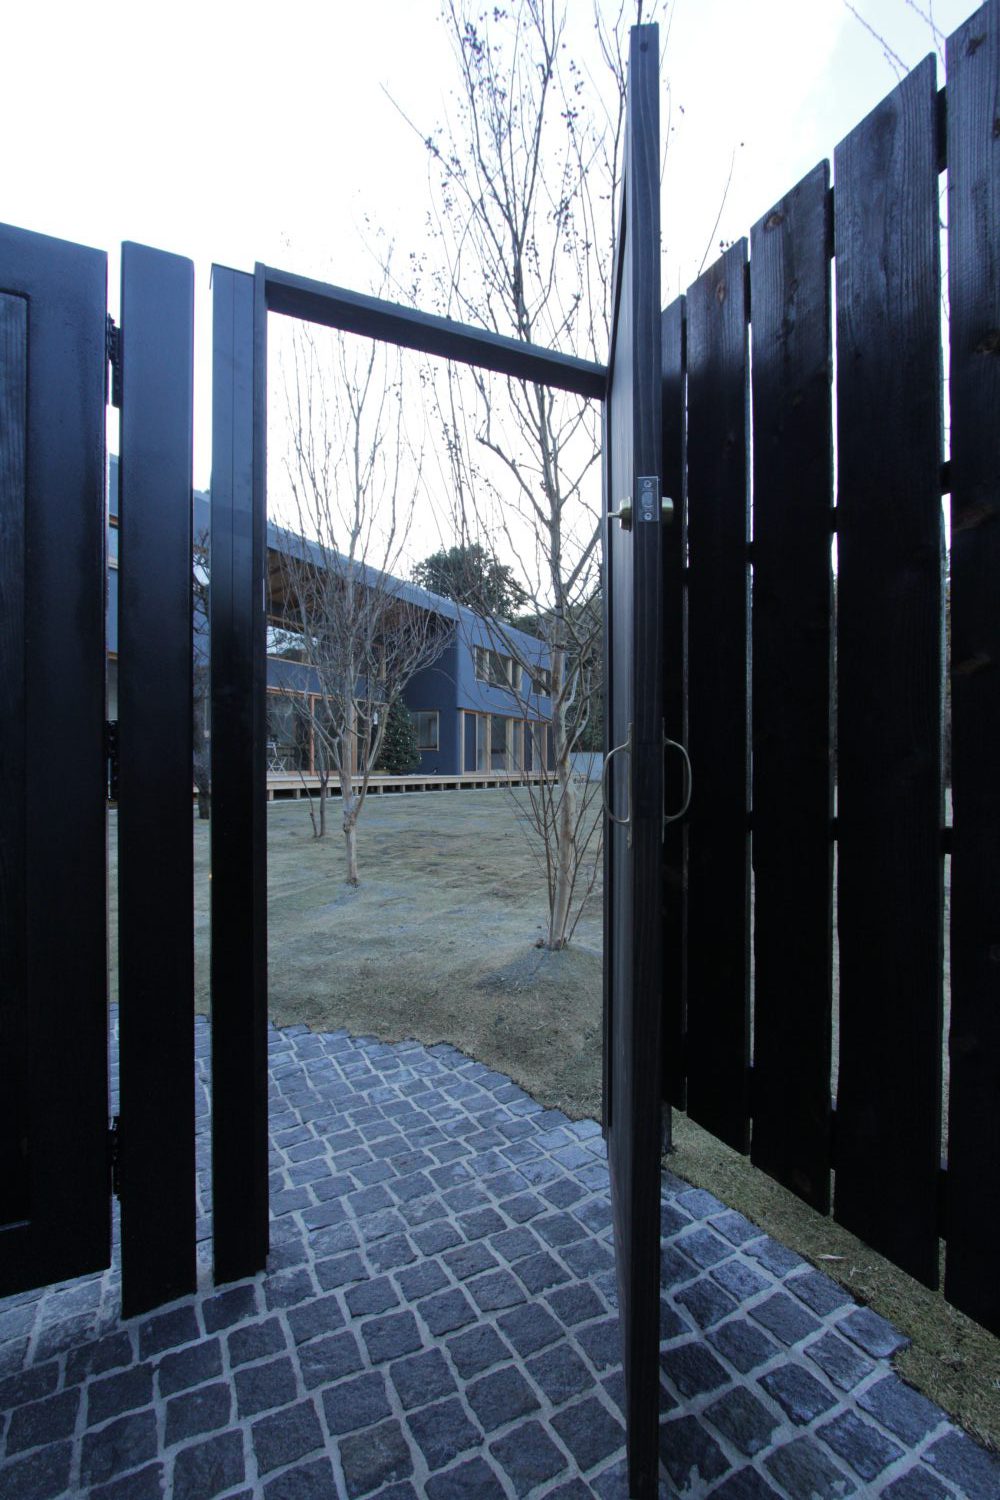
人用のゲート。室内と同様、真鍮の取手で変化をつけてみました。
こちらは車用ゲートの内側から。
ゲートは鉄骨亜鉛メッキ(ドブ漬け)に専用の塗料で黒色に塗装しています。
幅4.4m、高さ2mのサイズ感です。
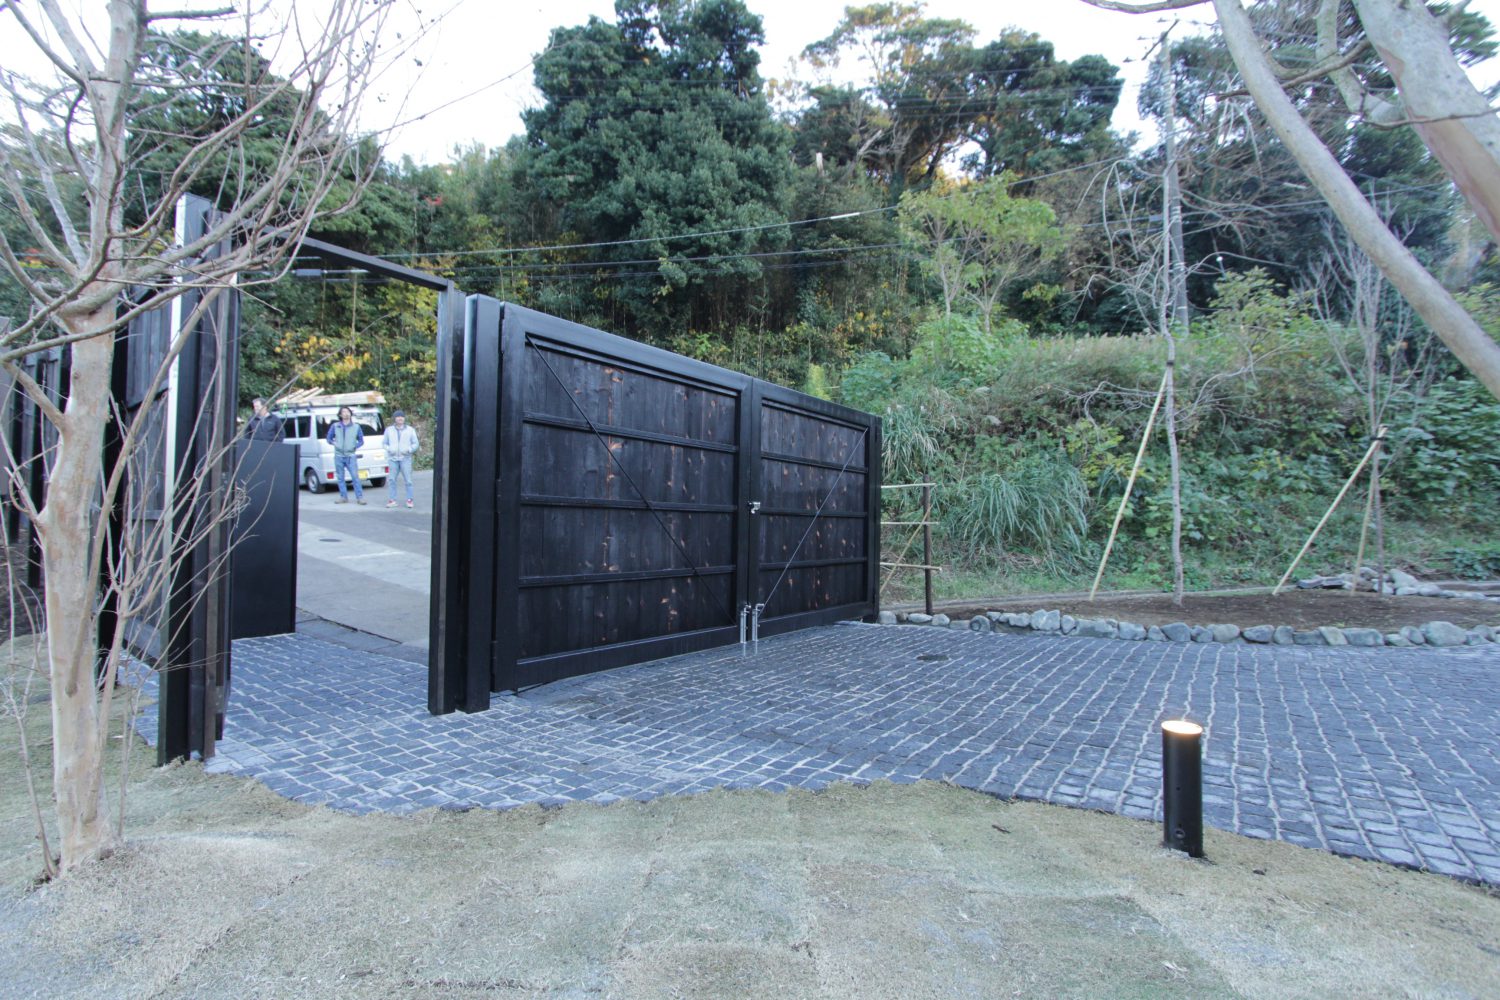
ゲートの中は、、
自然石のピンコロを、なんと16,000個も敷きつめました。
1,600個ではなく、16,000個!
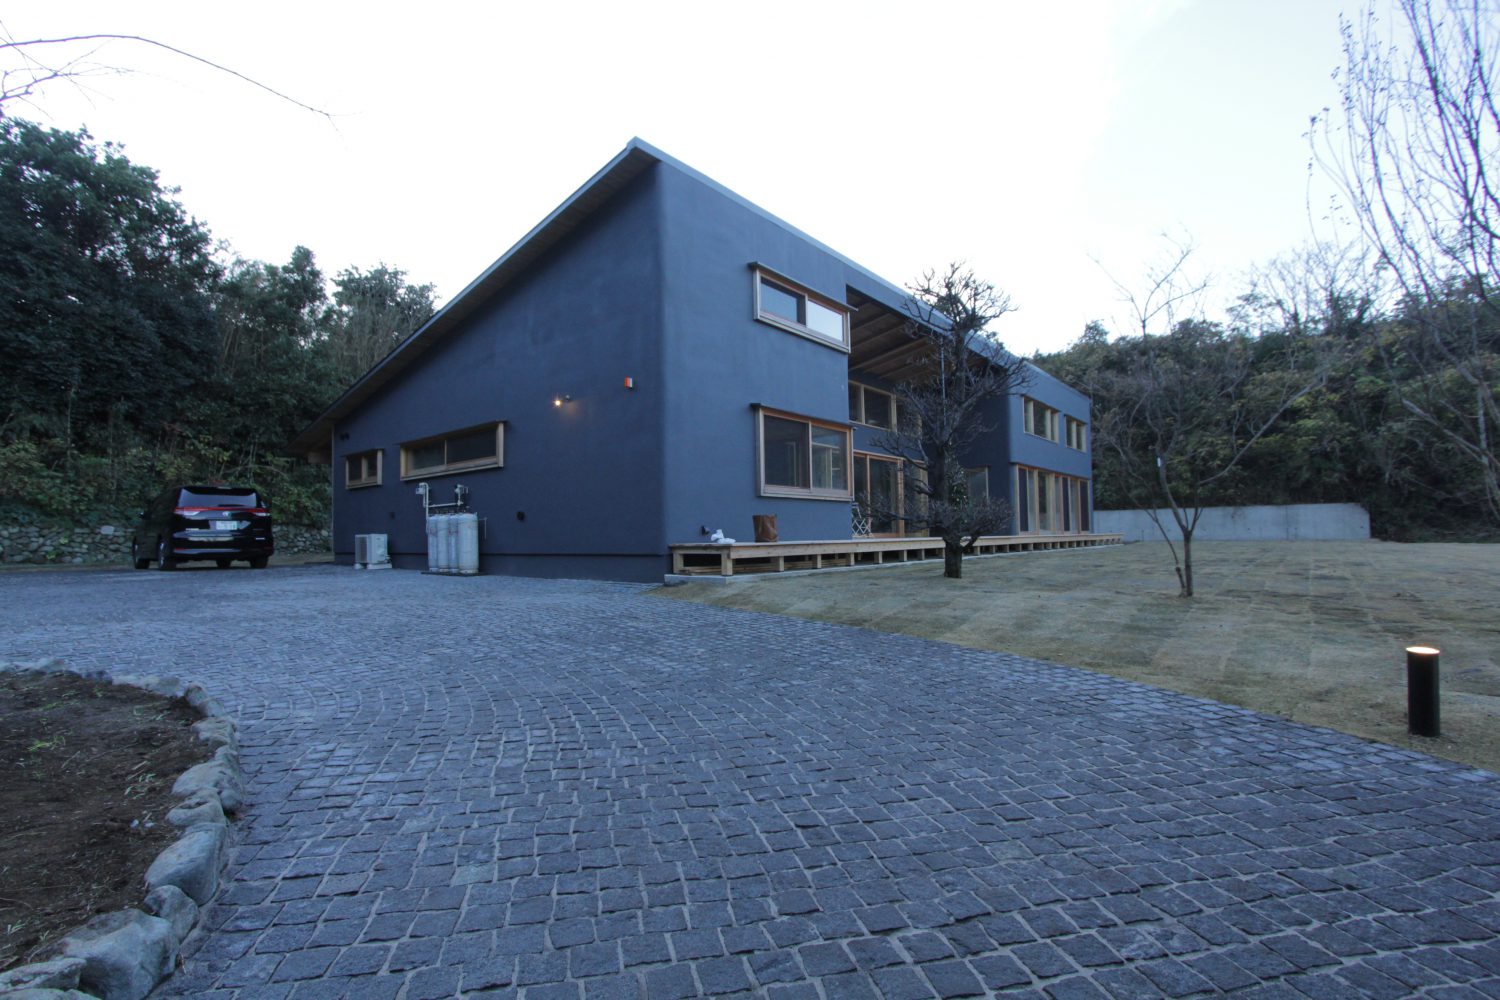
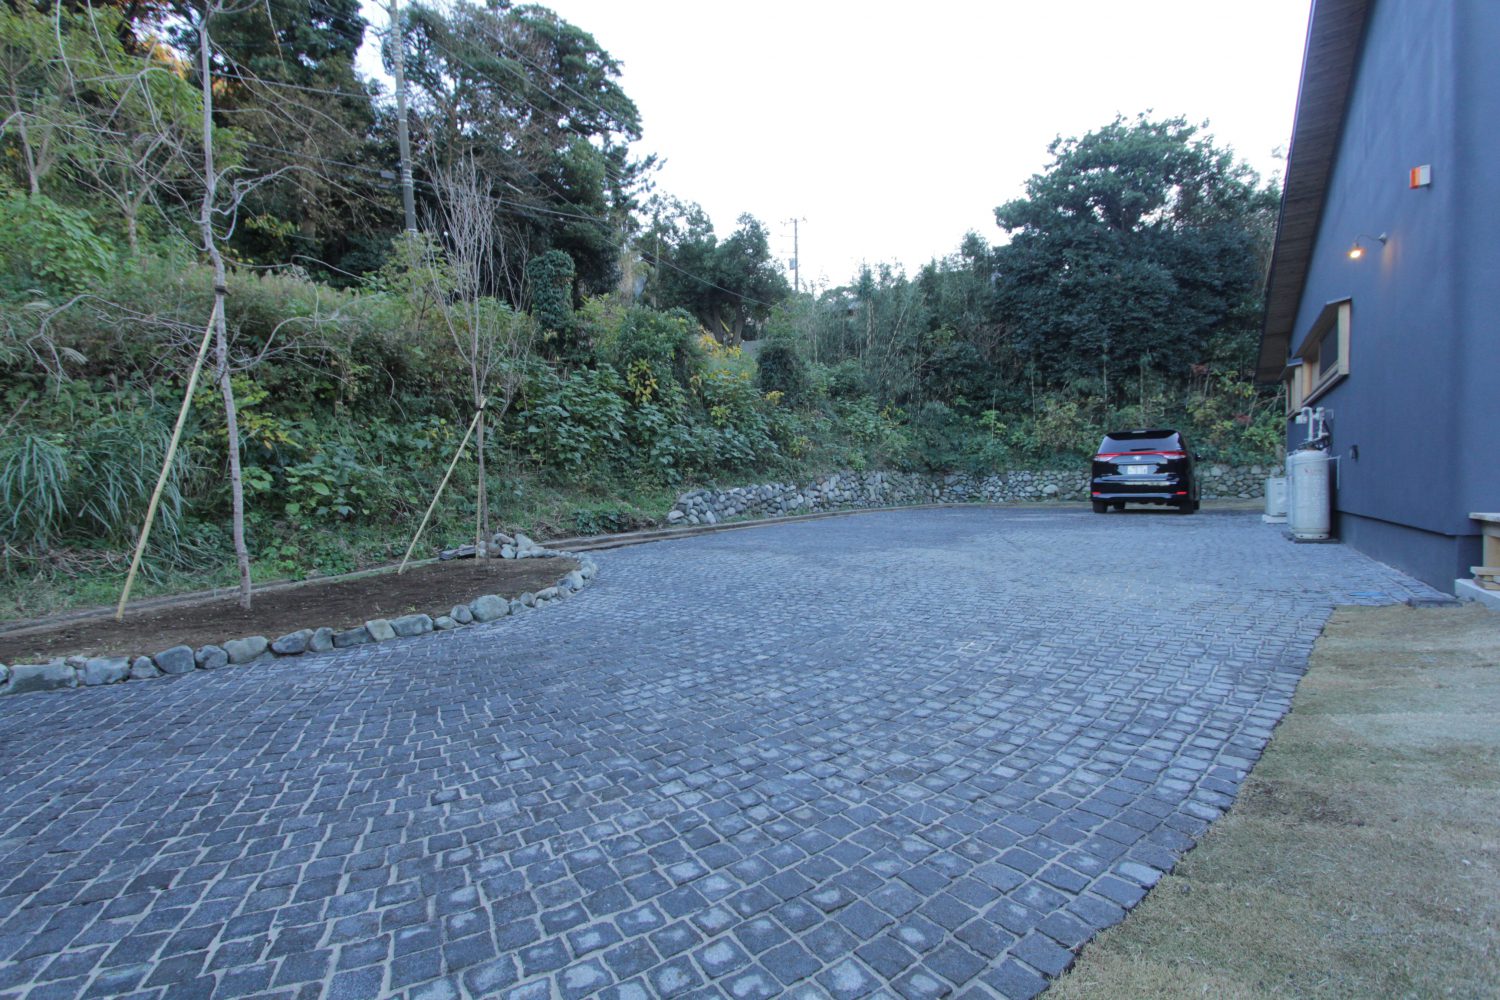
自然な感じのランダムさを出すのがなかなか難しく、試行錯誤しながら、
ピンコロ一つずつ、高さを揃えながらを並べていく。
見ているだけでも気の遠くなる作業でした。
それから、、850m2分の芝張り
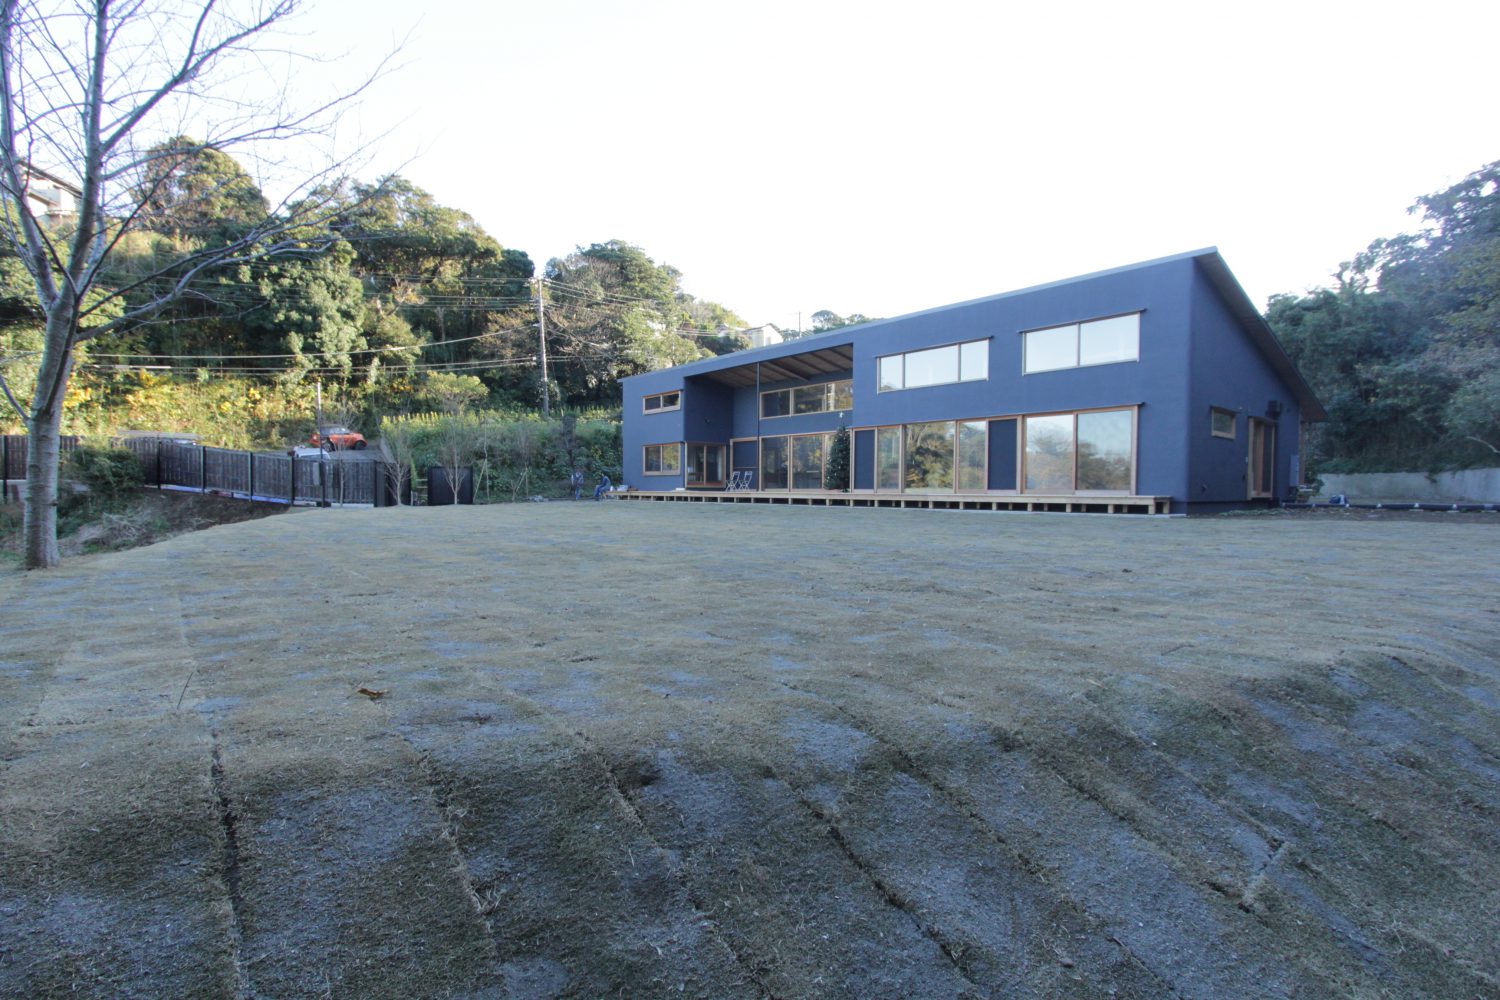
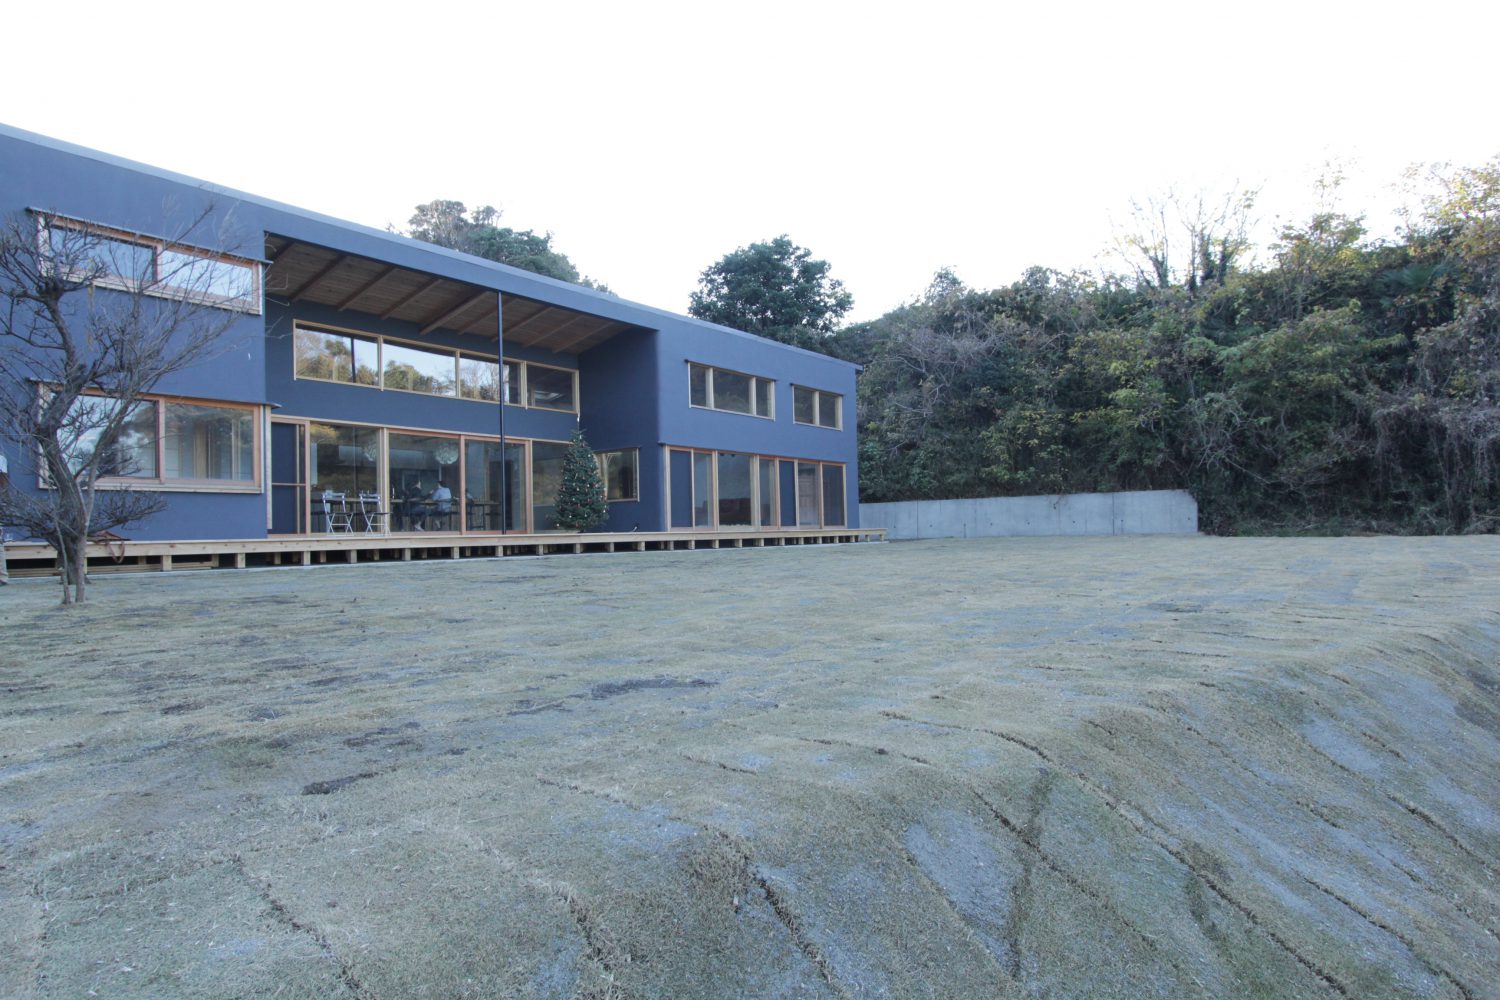
大小様々、石がゴロゴロ出てくるため、下地作りも一苦労でしたが、
芝を張り終えると壮観です。
とても広い敷地のため、外構工事で2ヶ月ほどかかりましたが、
見違えるほど綺麗になりました。
クリスマスの準備をしていた最終日、室内はこんな感じ。
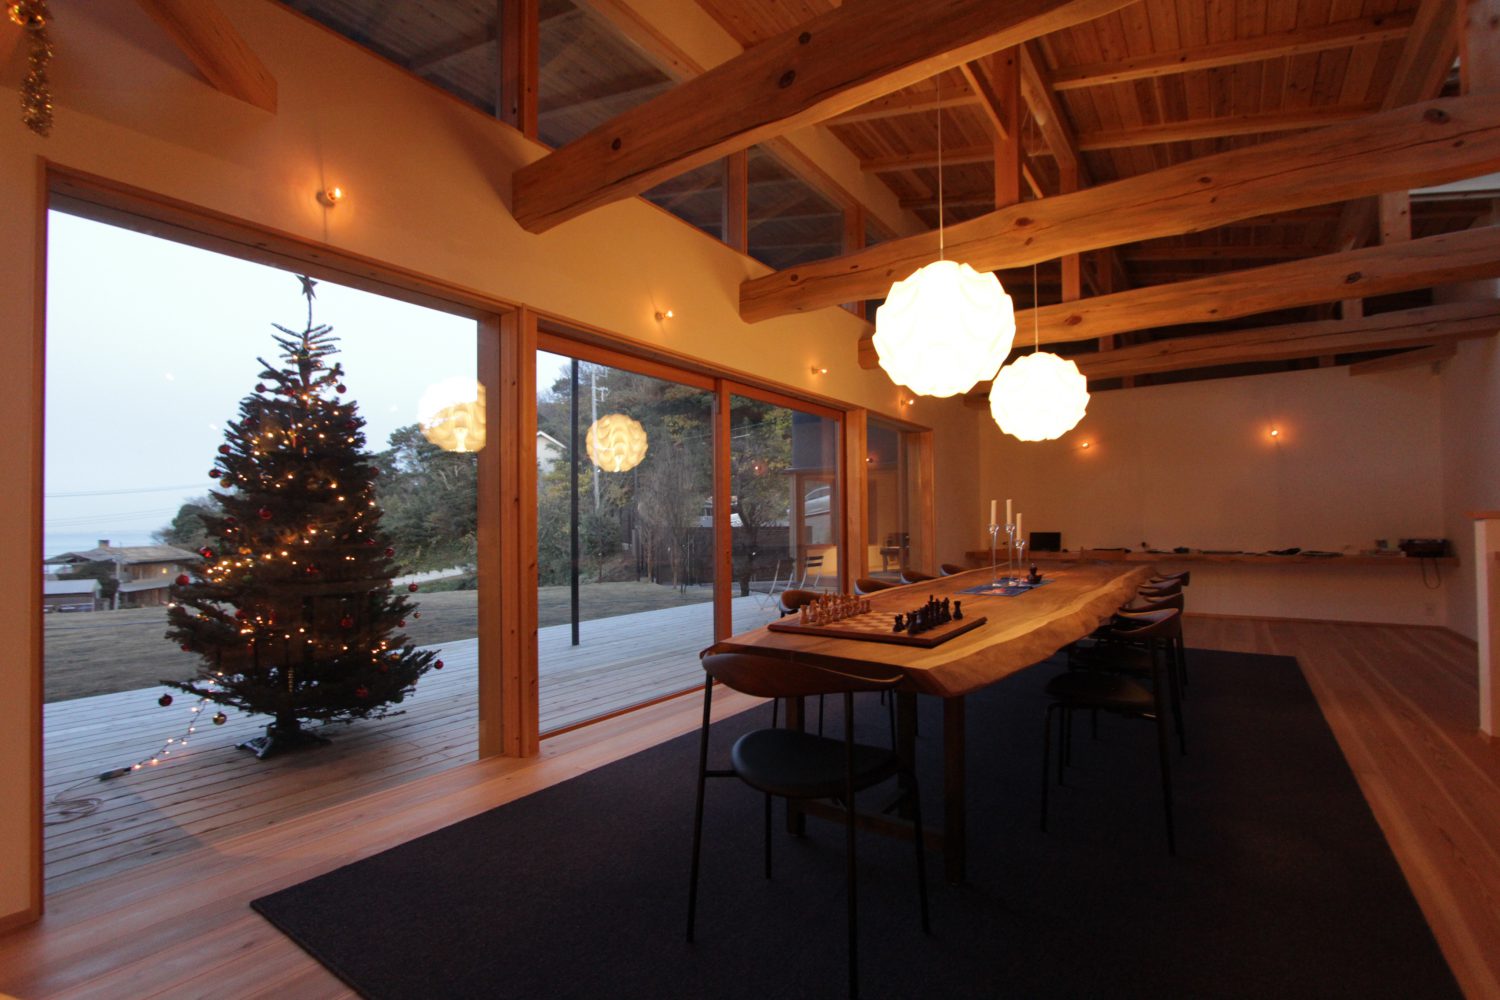
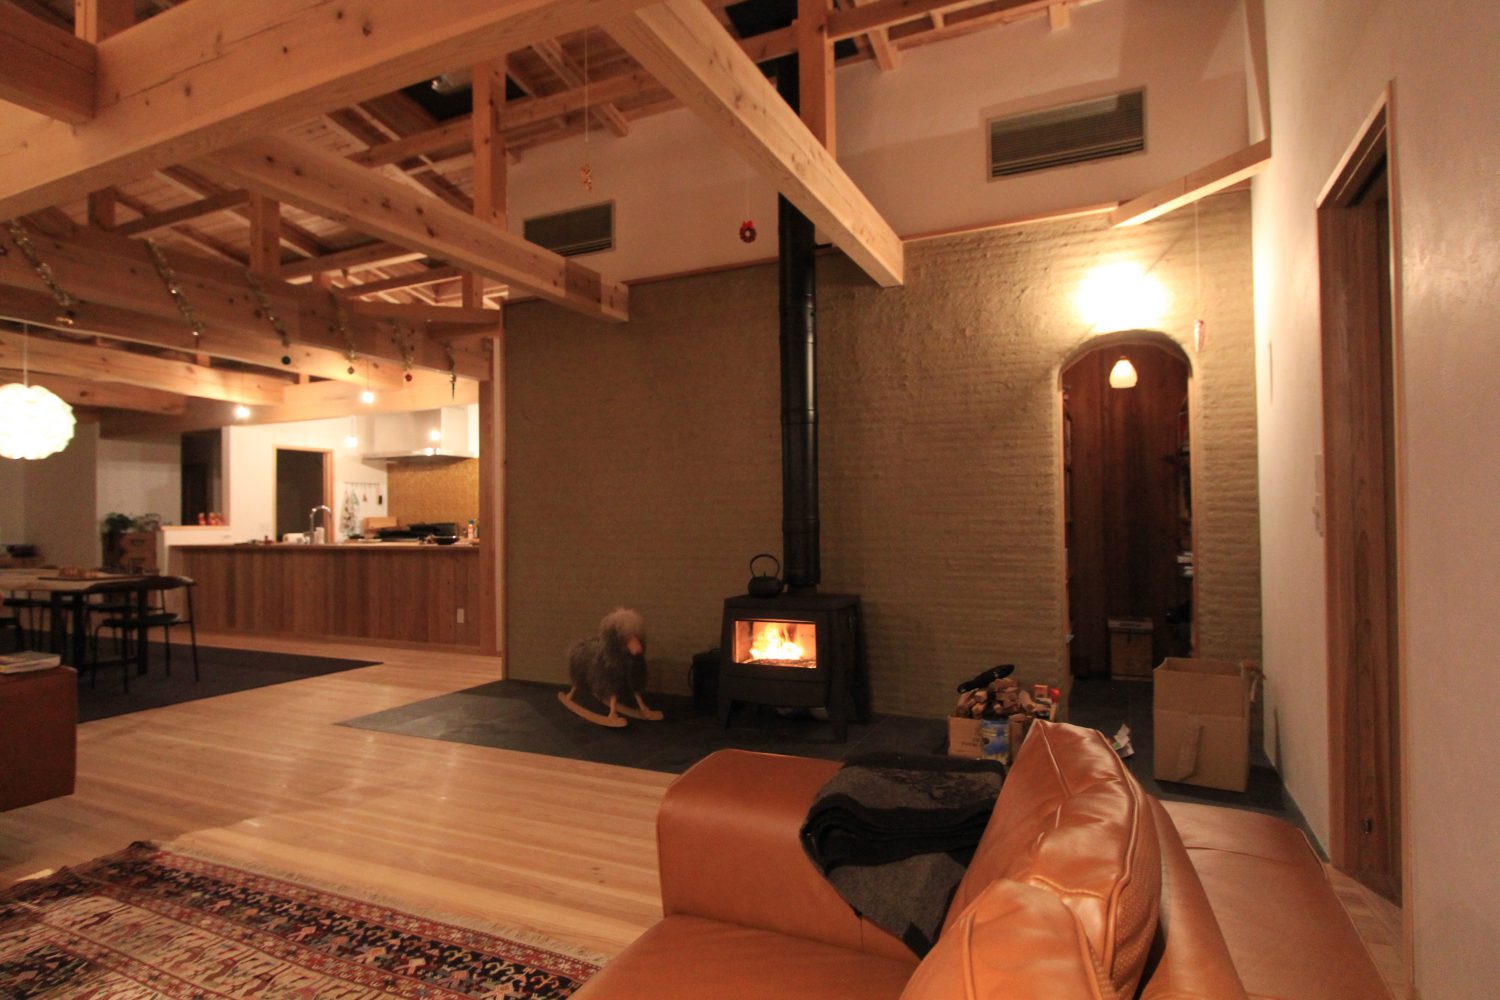
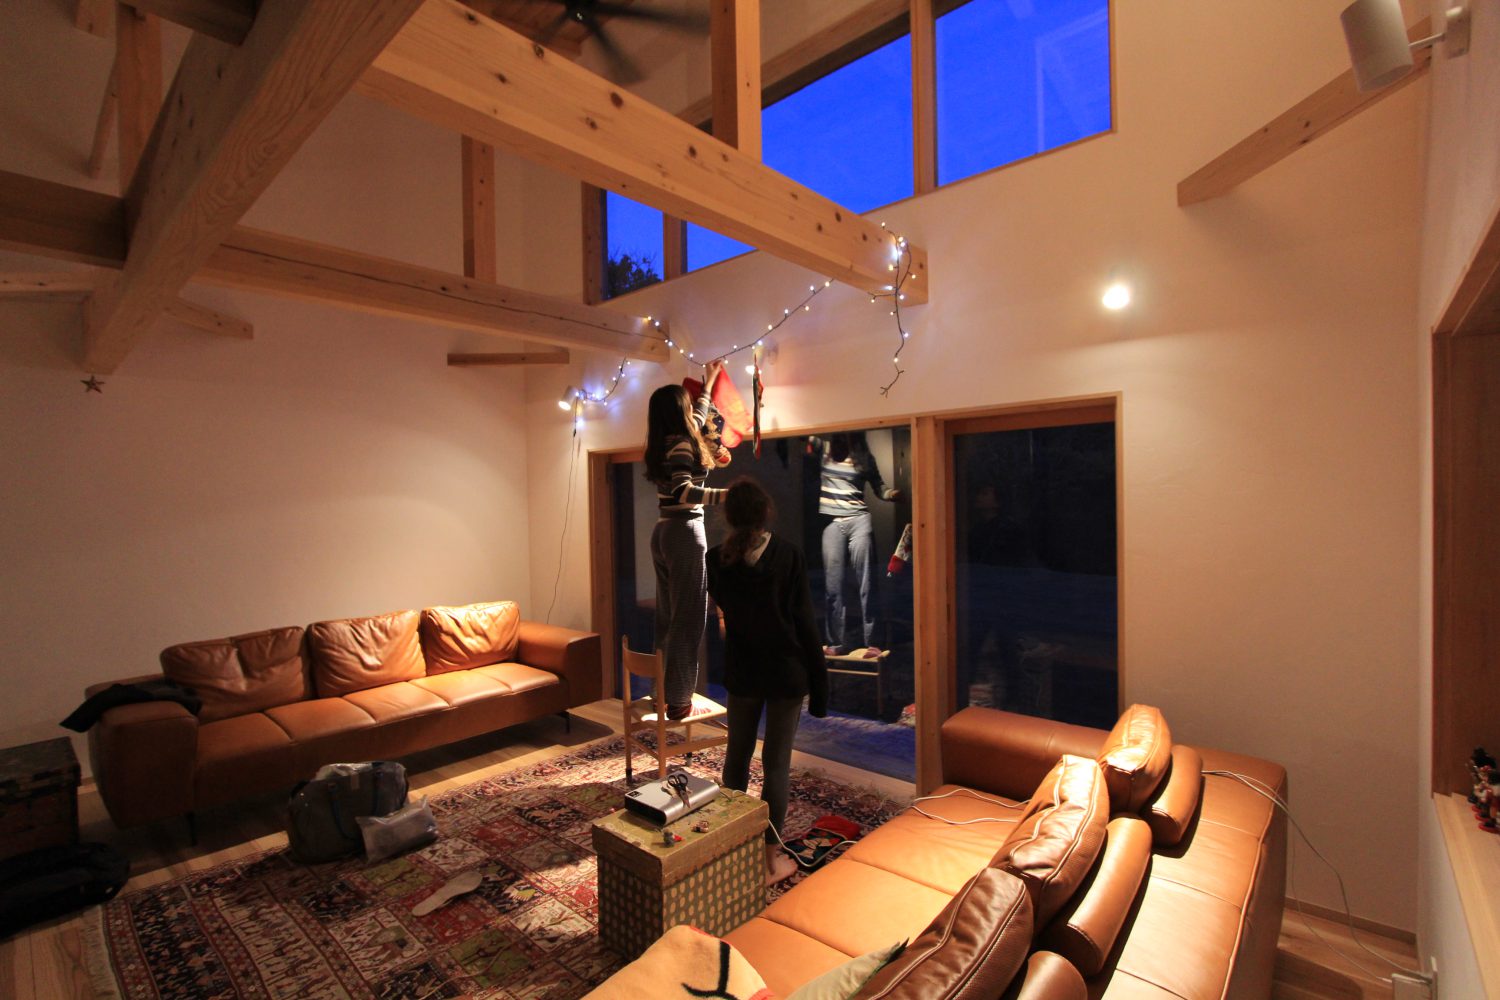
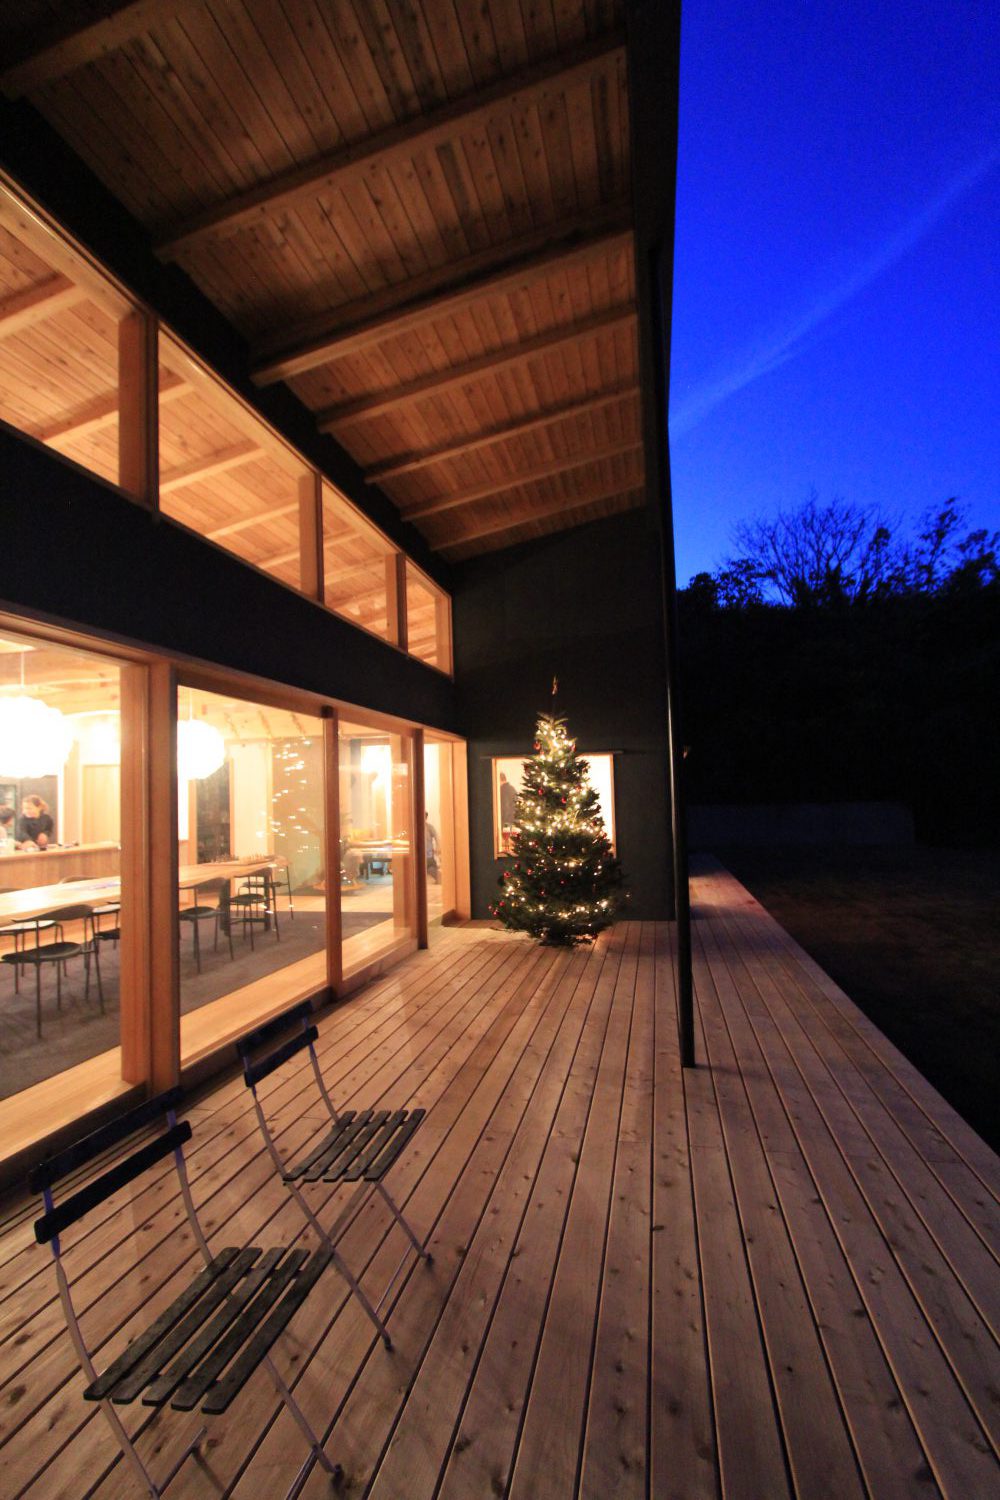
どこを見ても、あたたかな空気が流れていました。
丁寧に暮らしている事が手に取るように感じられて、作り手としてはとても嬉しく思います。
続 三浦の家(水周り編)
2020/12/5
夏に完成した三浦の家 水周りのご紹介です。
まずはキッチンから。
II型で、通路幅を1.3m確保した広々使えるオーダーキッチンです。
天板は、無垢板を剥ぎ合わせたもの。シンク側は長さが4.5mもあります。
水場で無垢板の天板を使う事を躊躇される方もいますが、
お手入れは他の素材とそんなに変わりません。
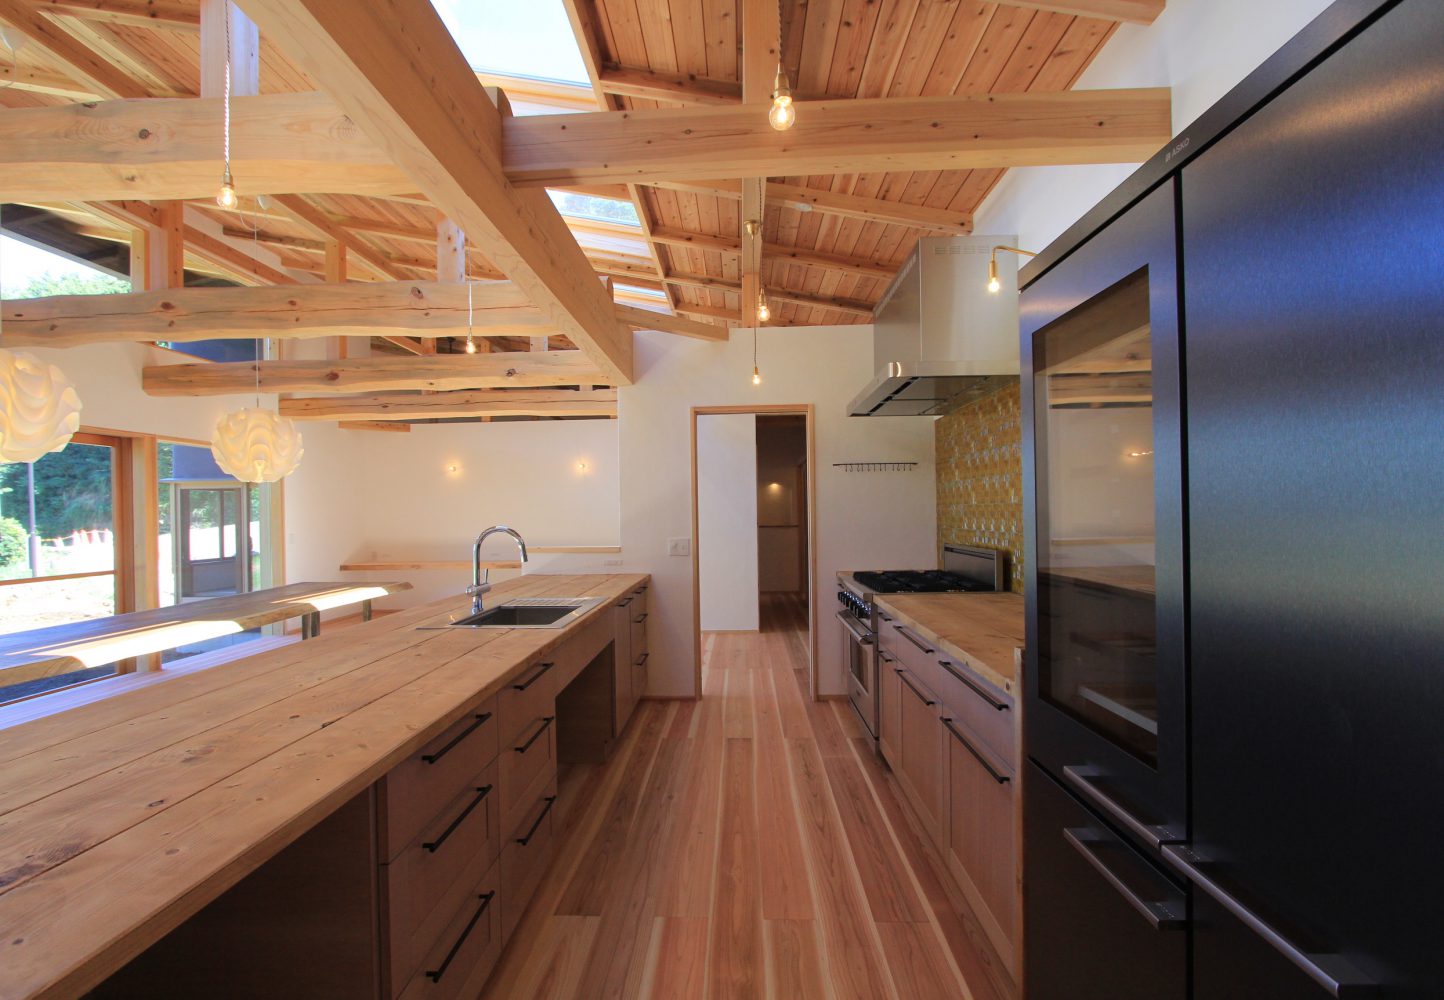
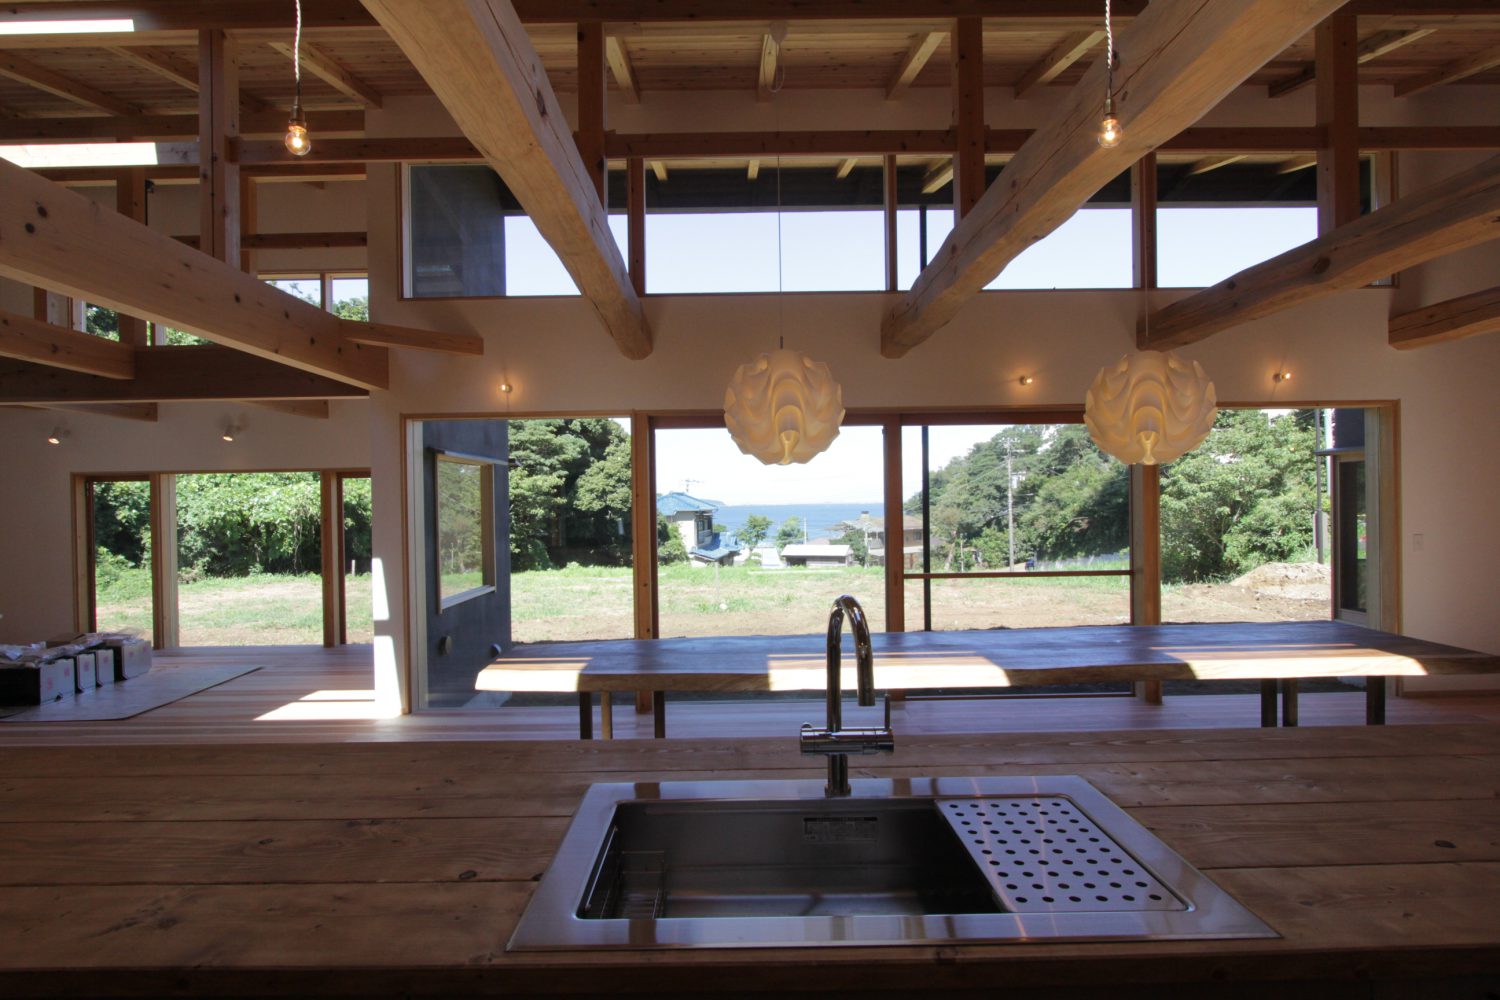
キッチンに立つと、森と海が同時に見えてきます。
シンクはステンレスで幅900mmほどの大きめなサイズ
カウンター下には幅600mmのASKOの食洗機もセットしました
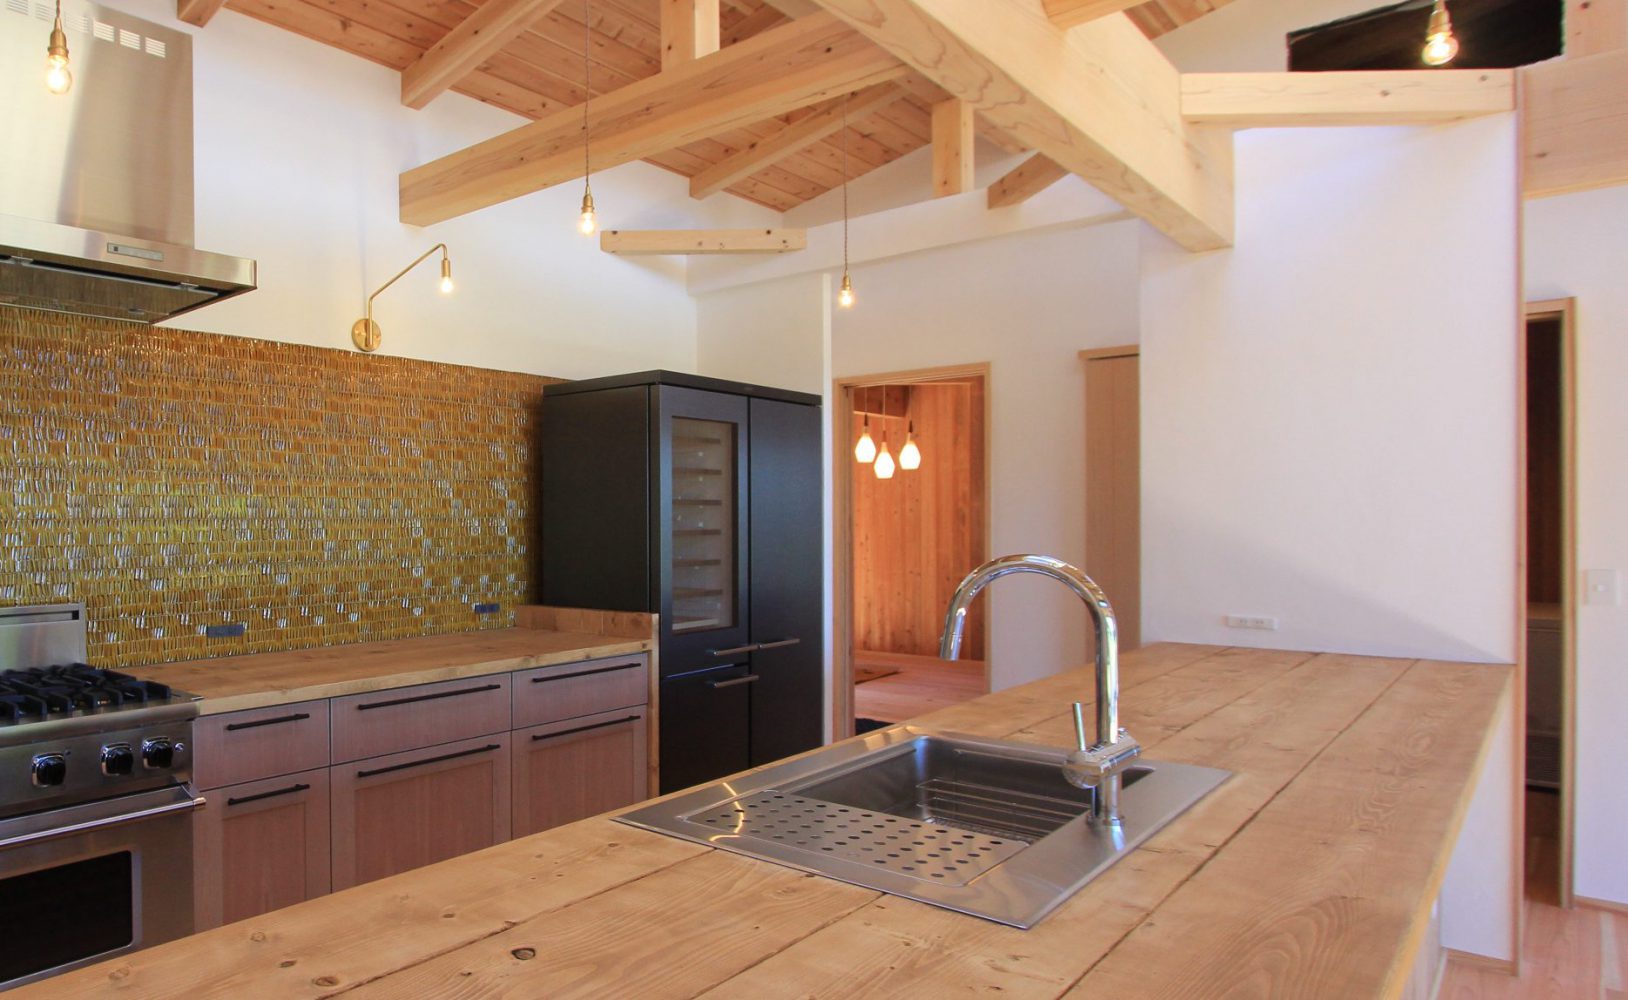
コンロ側の壁にはイタリア製のレトロなデザインのタイルをチョイス。
照明はシンプルな真鍮のペンダントとブラケットで揃えています
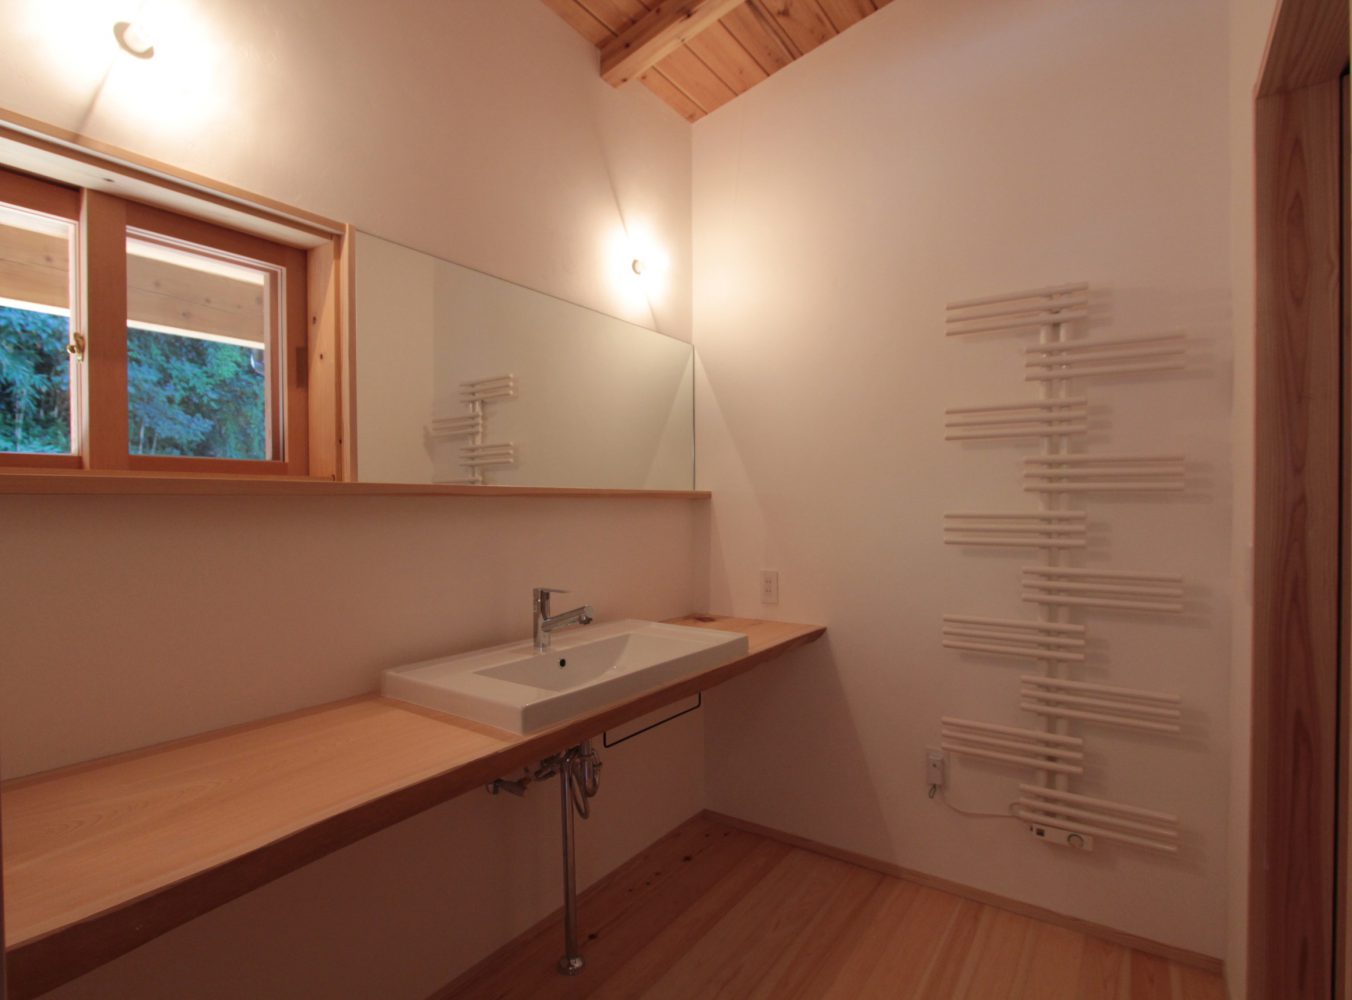
続いて、洗面室(2ヶ所)
シンプルに無垢板天板と流しだけの造作です。
漆喰の壁に、ヒノキの床板
タオルウォーマーは壁に馴染む白色としました。
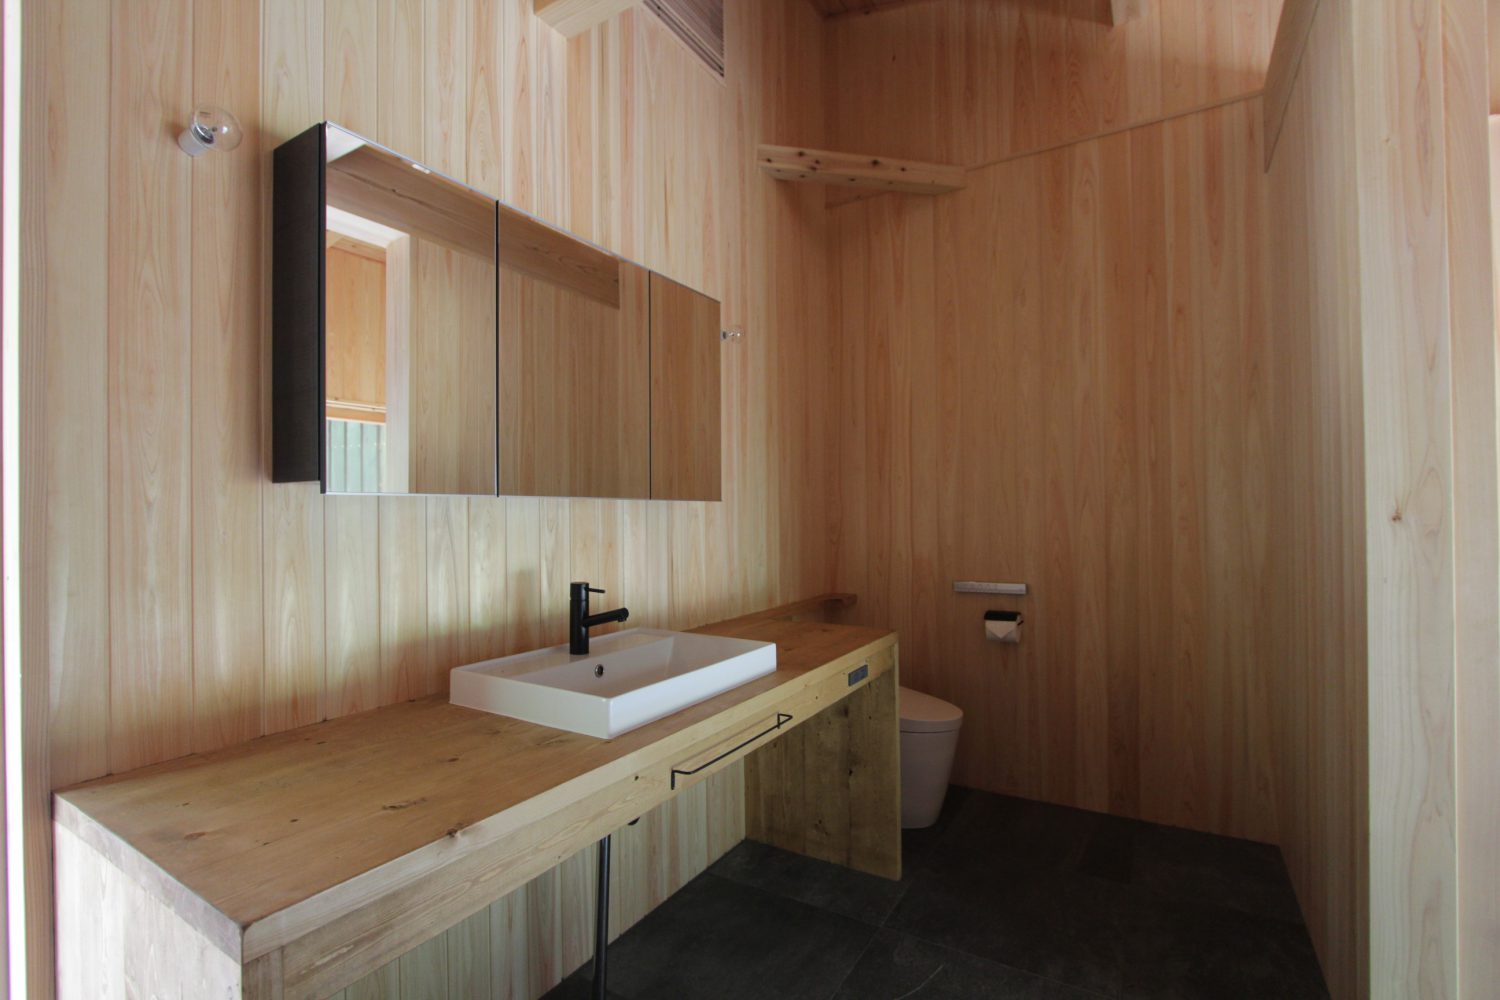
こちらは少しデザインを変えて、キッチンと同じ無垢板接ぎ合せの天板
壁はヒノキの板張り、床はタイルとしました
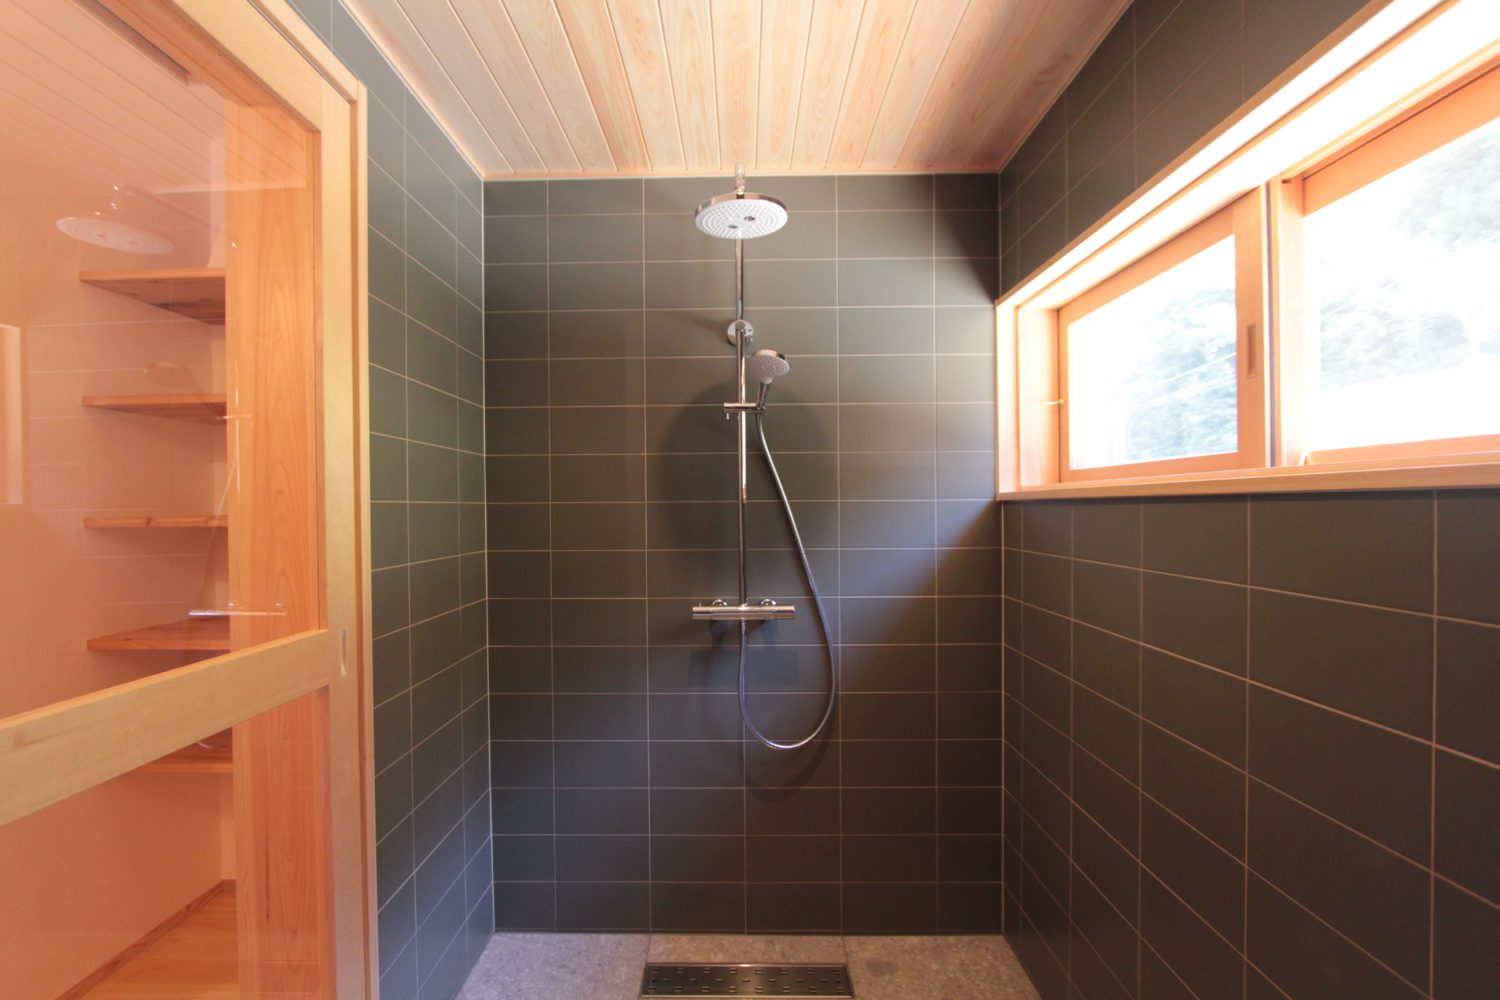
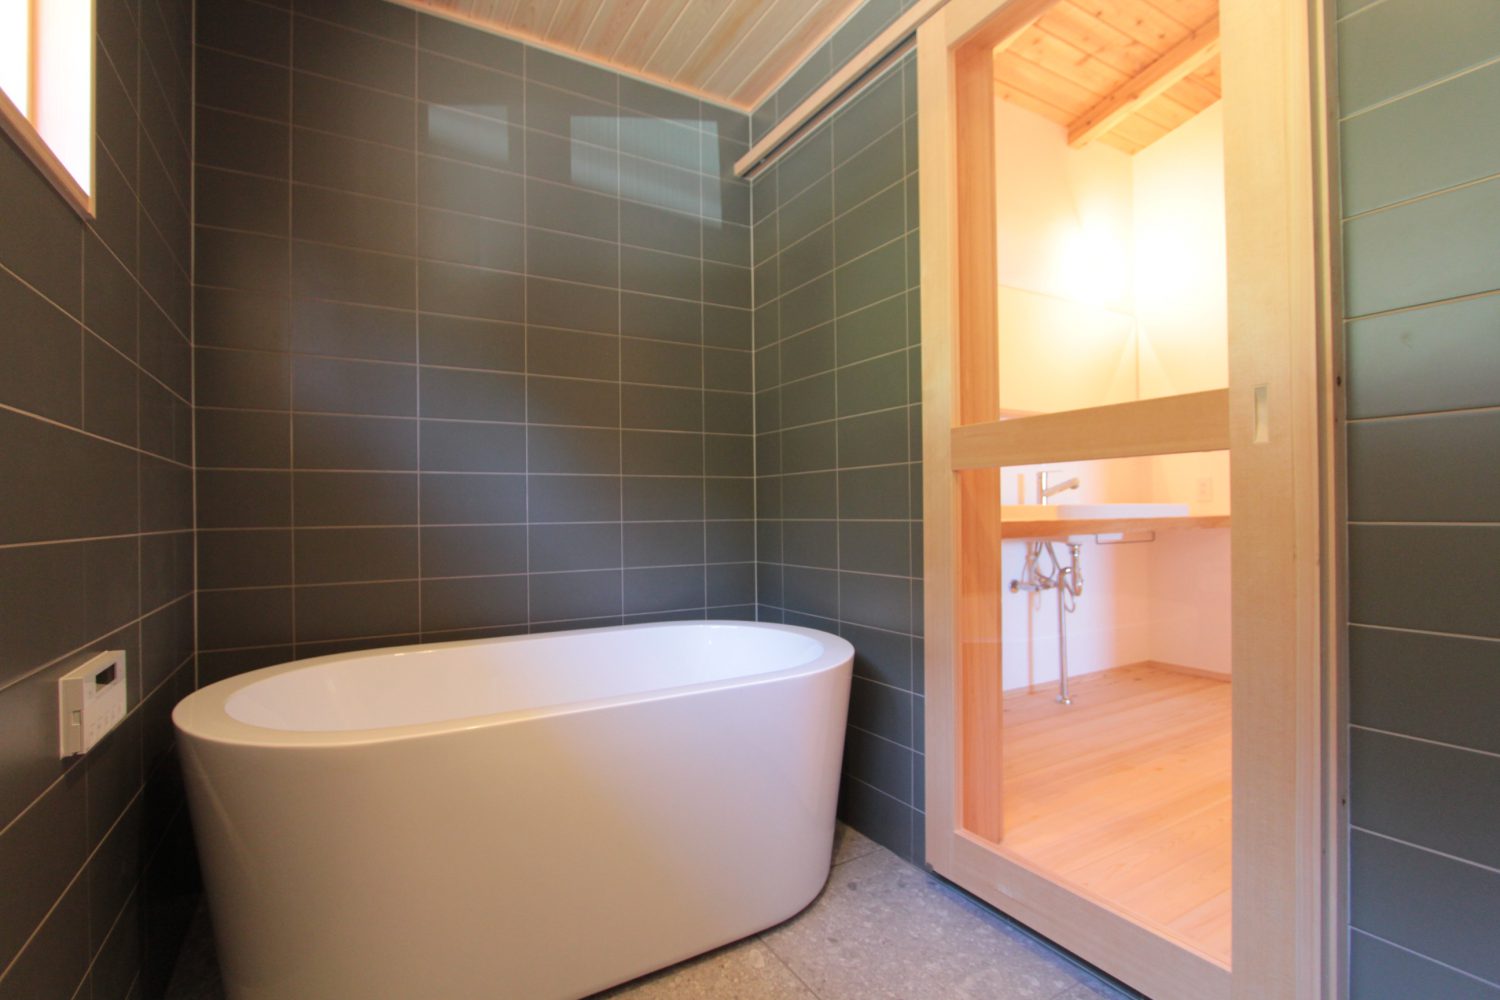
そしてお風呂(2ヶ所)
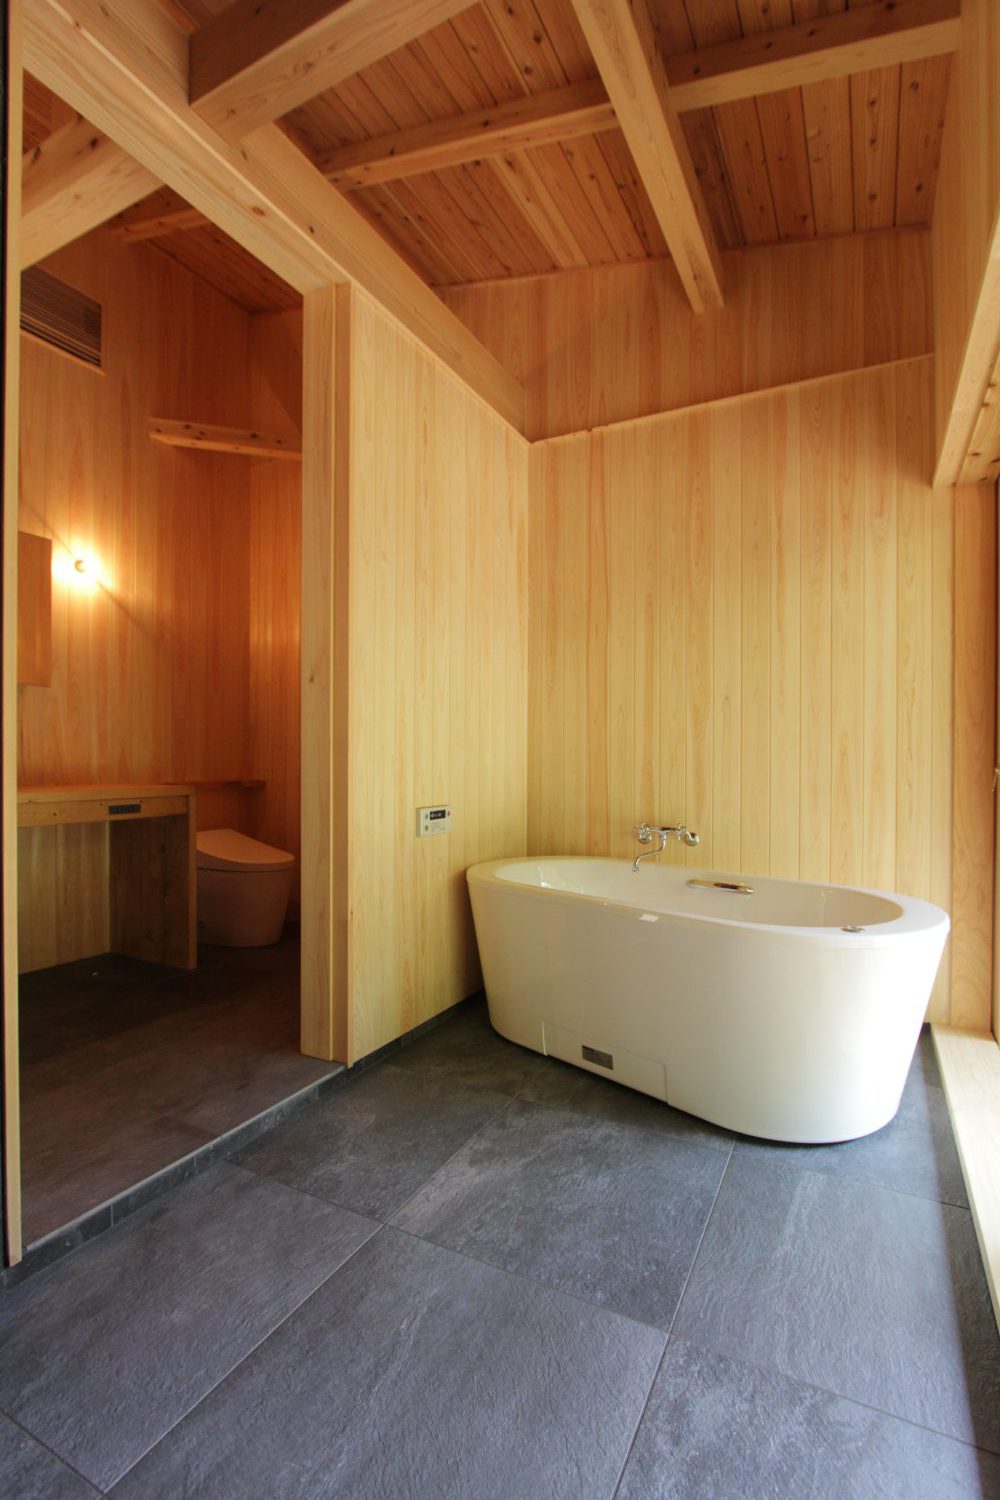
洗面室とは扉で仕切らず、オープンなつくりとしました。
浴槽の前には大きな木製窓。
(写真にはまだ写っていませんが、窓の外にはデッキができています)
近隣から隔絶されたプライベートなお庭を眺めながら入浴ができます。
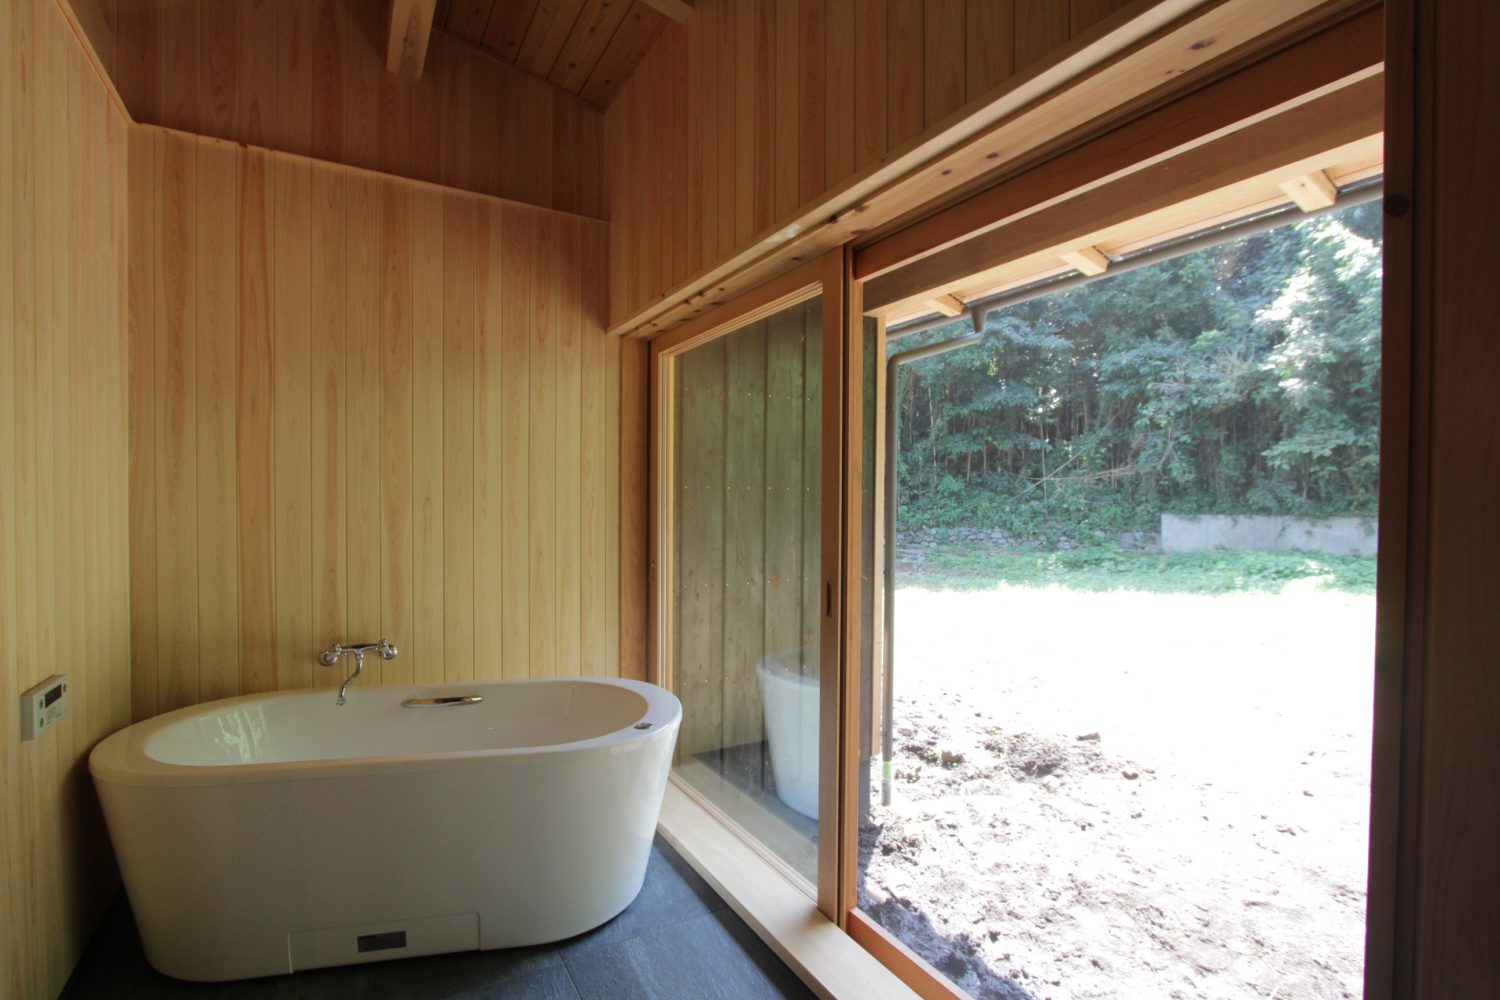
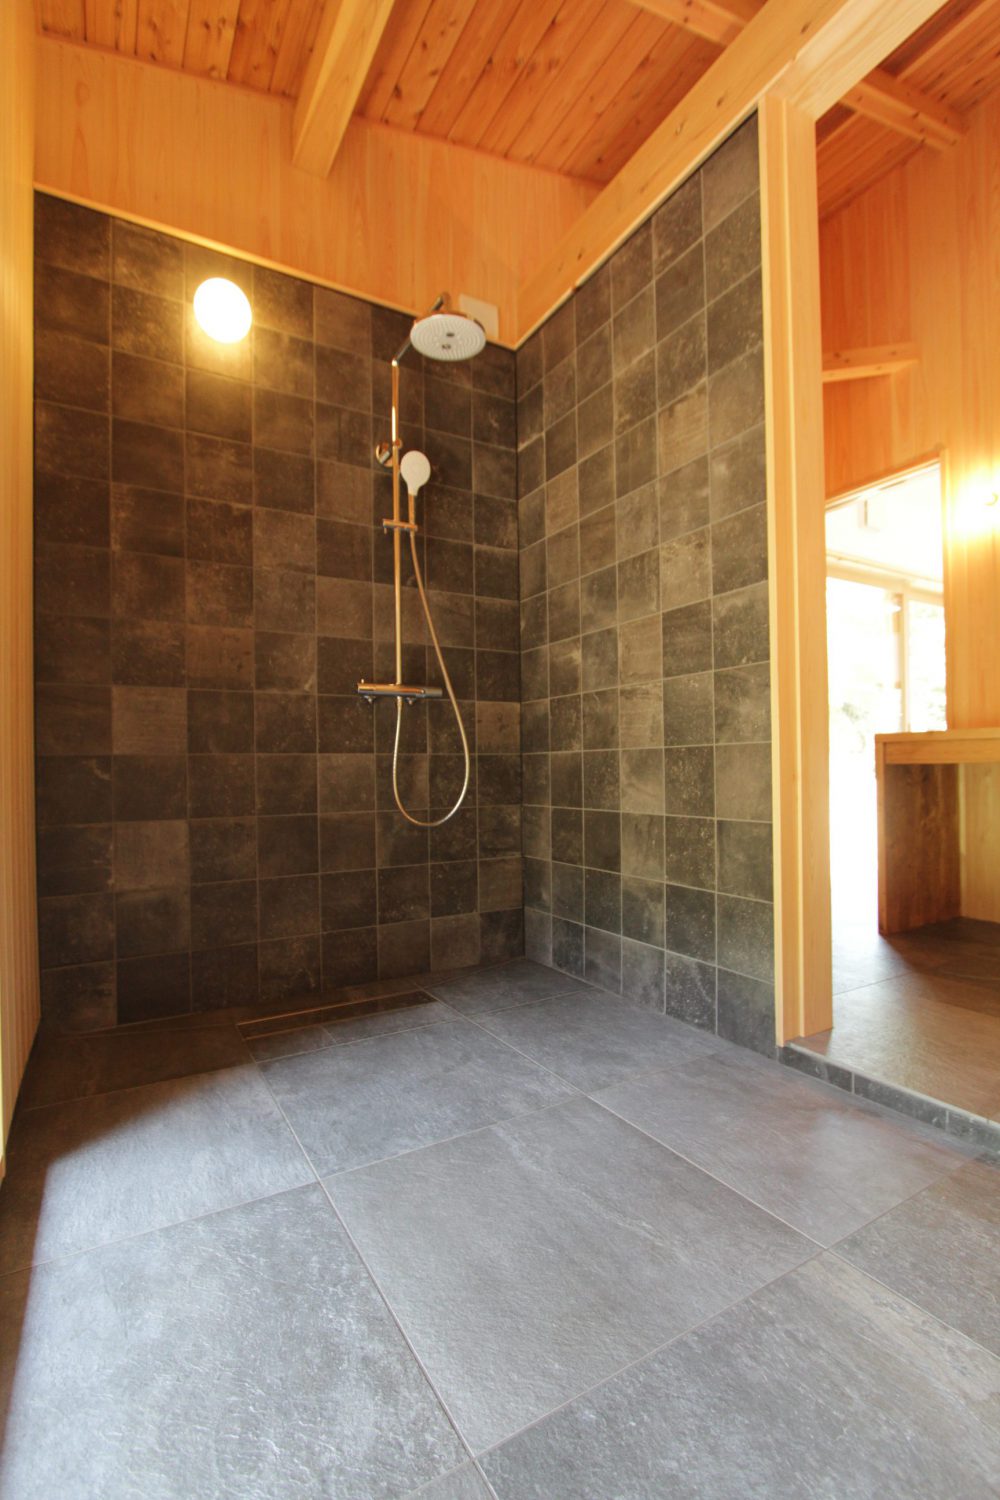
壁面は、タイルとヒノキの板を使い分けています
こちらは4面シックなグリーンのタイルで仕上げました
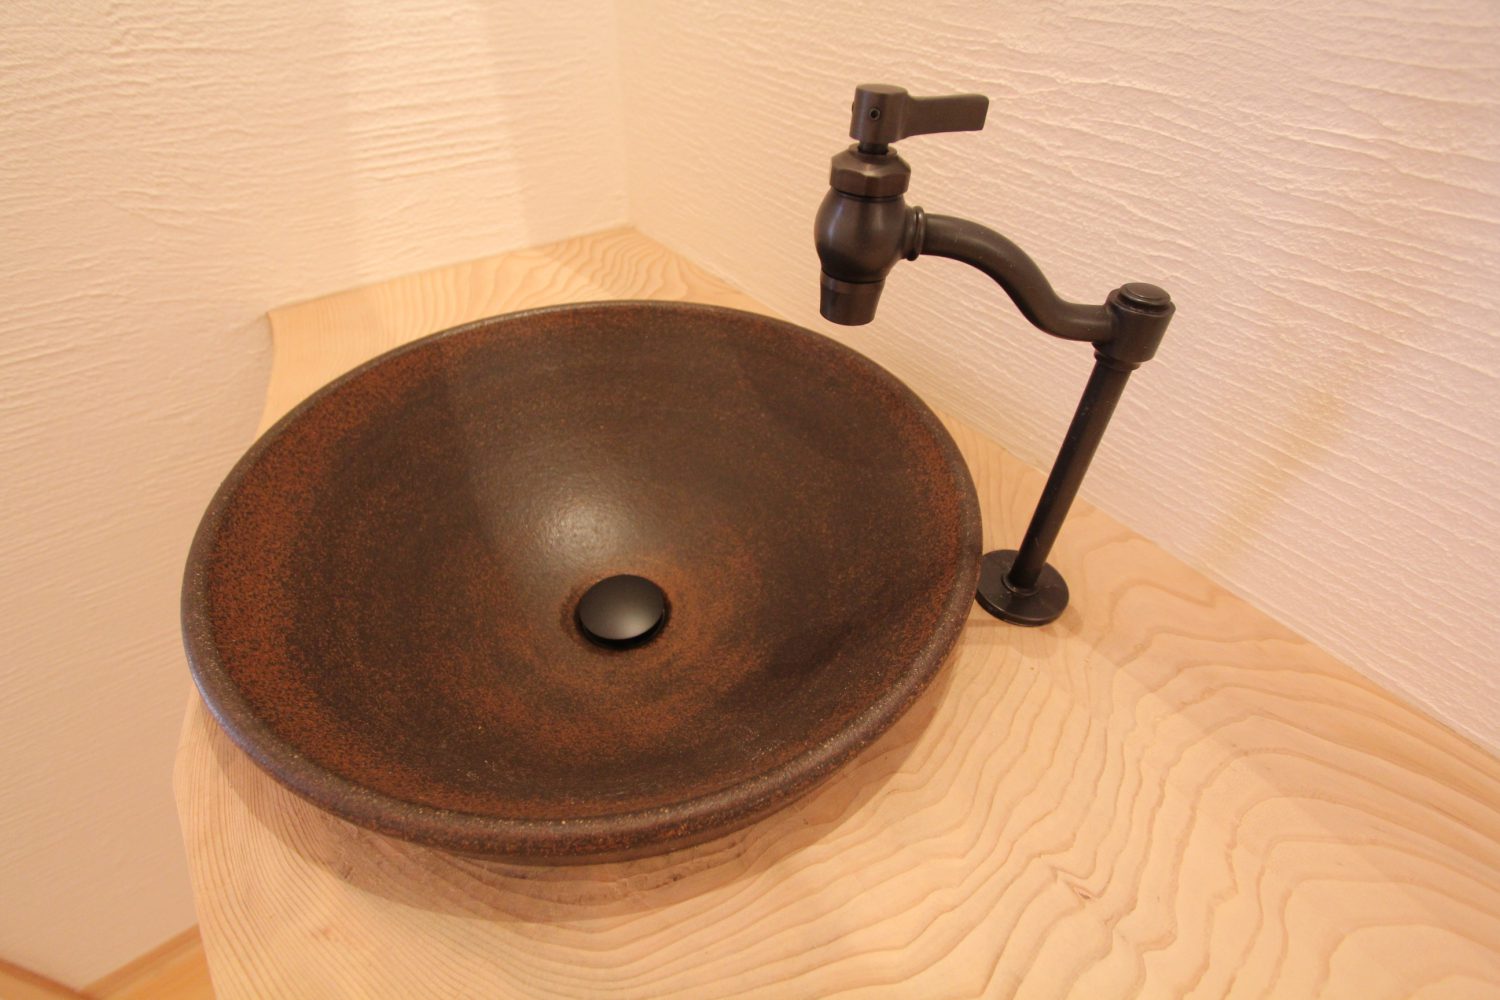
最後はお手洗いです。
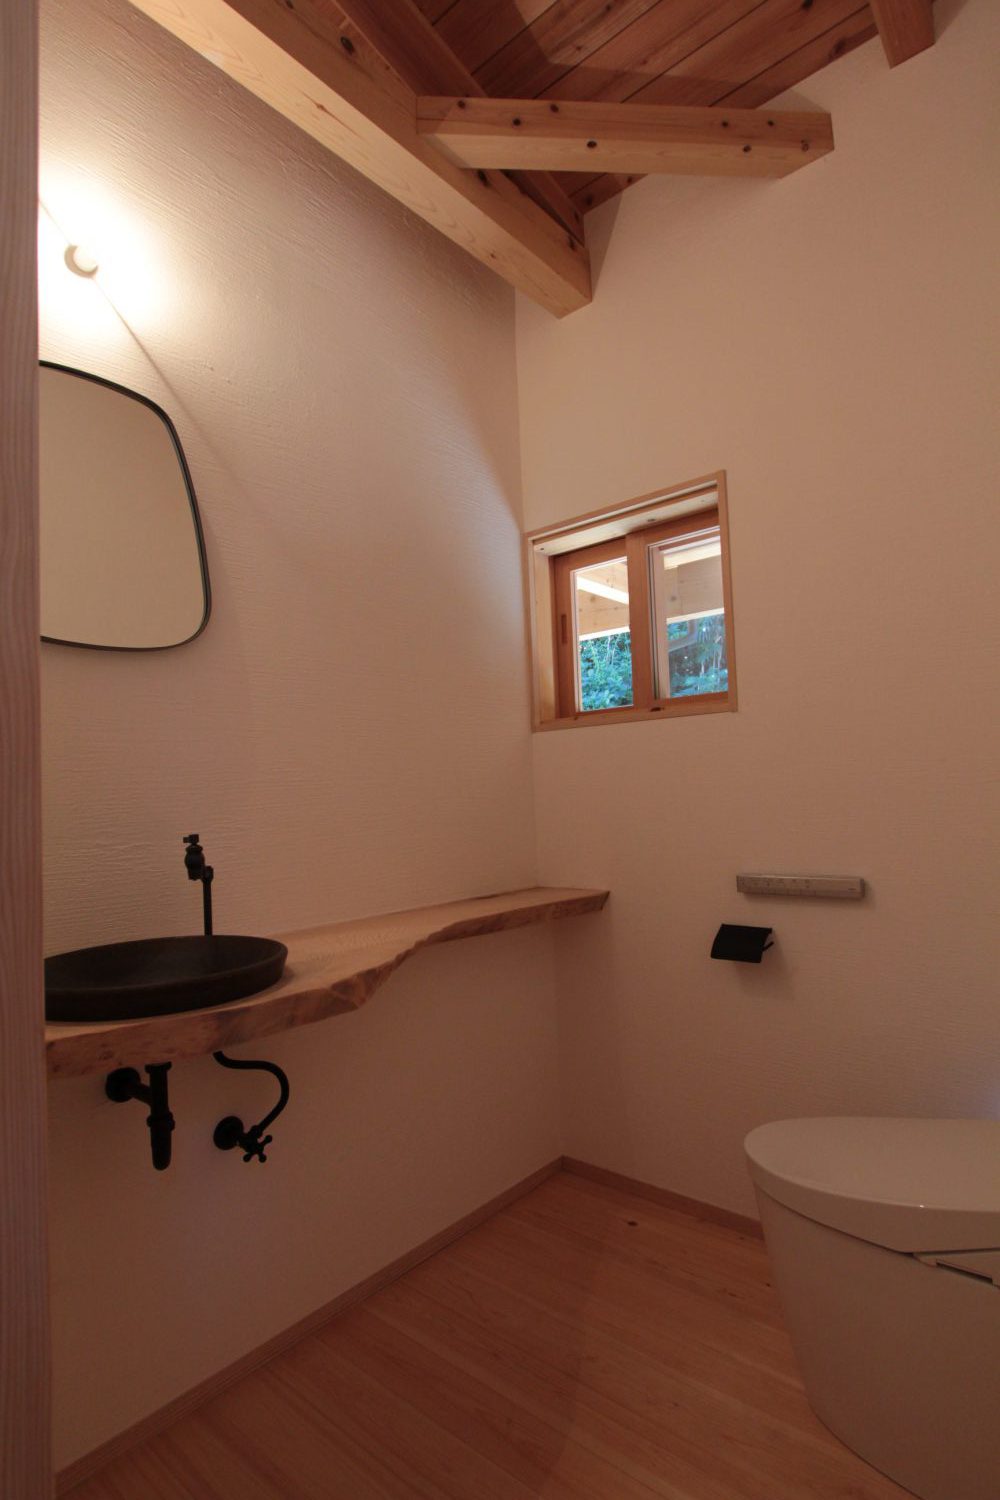
曲がりのある一枚板に、信楽焼のボウルを合わせました。
水栓や配管、紙巻は全てブラックで統一し、タオル掛けのみ真鍮でアクセントを加えてみました
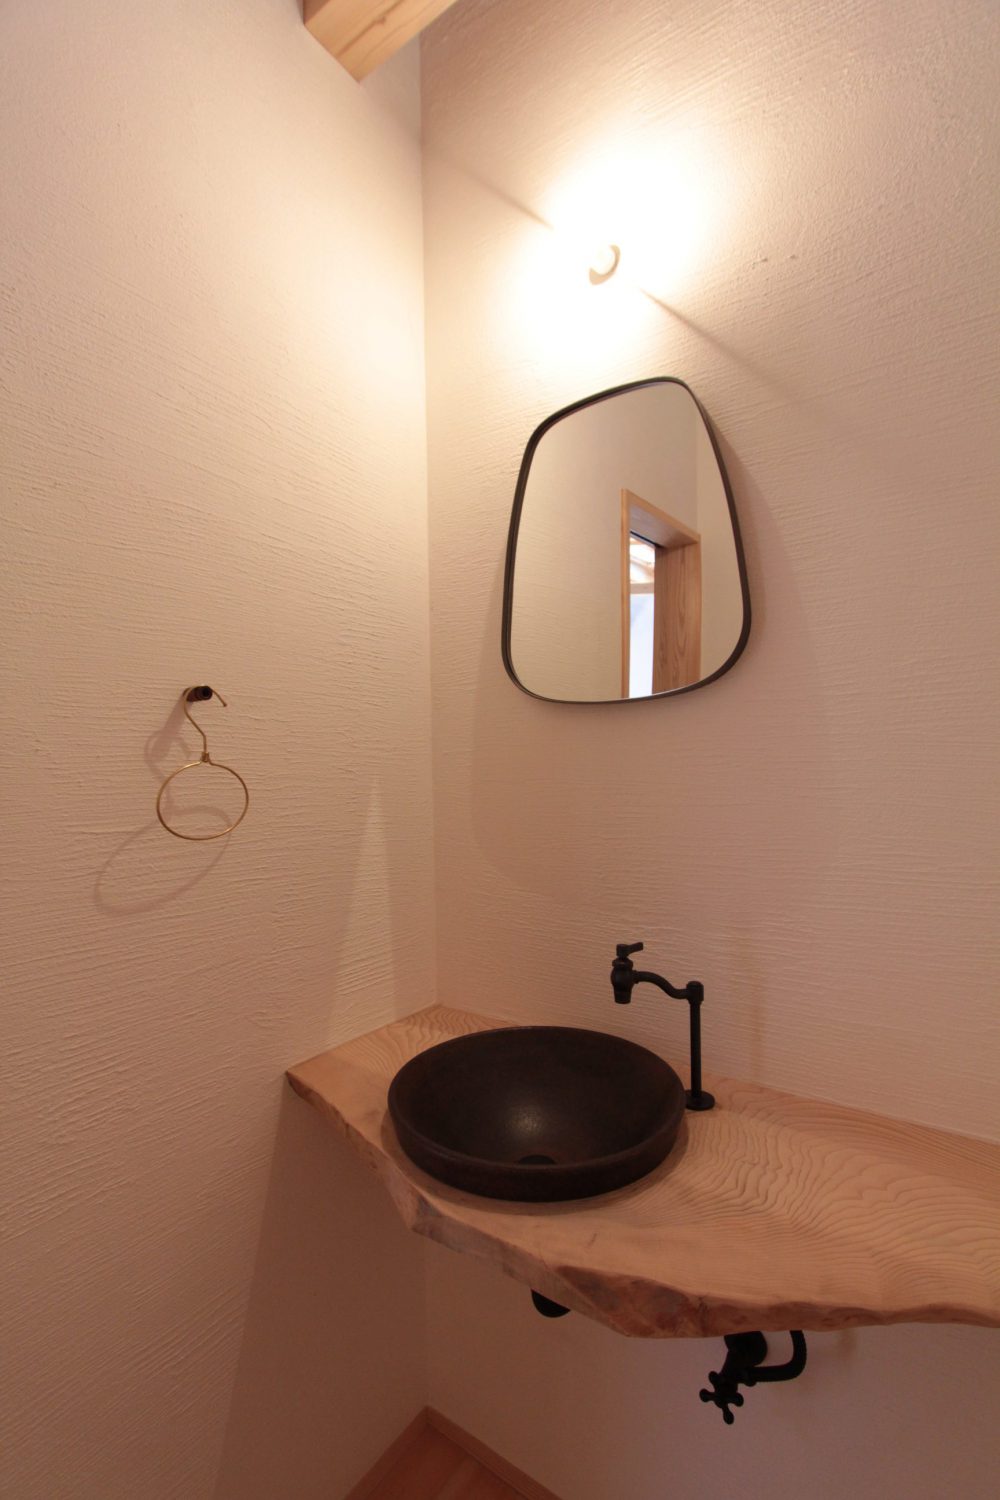
お手洗いの漆喰の壁は、陰影が出るよう「引き摺り仕上げ」としました
以上、三浦の家の水周りのご紹介でした
ただいま外構工事を進めており、もう少しで完成。
そちらも改めてご紹介します。
年末年始の休業のお知らせ 12/30〜1/3
2020/11/30
11月最終日、2020年も残すところ1ヶ月となりました。
年末年始の休業予定をご案内いたします。
■日程:2020年12月30日(水)~2021年1月3日(日)
休暇中のお問い合わせにつきましては、1月4日以降に順次ご連絡させていただきます。
どうぞよろしくお願いいたします。


